

Card payment habits in Malta
Salient points
- In 2024, card payments accounted for 60% of all supermarket sales, making them the dominant payment method in the industry.
- Fuel stations show lower customer preference towards card payments, with only 30% of transactions being made by card.
- Card payments surged in August 2025, increasing by €90.1 million (18%) when compared to the previous year.
- The Gozo and Comino district recorded the highest card acceptance rate among retailers at 68%.
The retail industry accounts for the highest total card payment value across industries, registering €1.89 billion, representing a 37% share of the combined POS and online card transactions.
1.0 Introduction
The rapid growth of digital technologies presents a wide range of new and innovative opportunities for broadening digitalisation. Various studies suggest that electronic payments are increasing in popularity driven largely by the growth of Fintech [1]. Access to card payment data offers an innovative perspective of economic activity with minimal time lag in comparison to traditional methods. This type of non-traditional data source has the potential to enhance and improve economic measurement techniques by providing rich, near real-time, and highly detailed insights, while also helping to reduce the administrative workload and response burden on both businesses and individual consumers.
The National Statistics Office (NSO) obtains card payment data (i.e. debit/credit cards) from all locally licensed card acquirers, thereby gathering information on card-accepting merchants operating in Malta. This data, coordinated by the Central Bank of Malta (CBM), is provided within a few days following the end of each calendar month. Such a regular flow of data provides an additional and timely indicator, forming part of Malta’s statistical inventory to measure the spending activity within the domestic economy.
2.0 Results
To both consumers and businesses, card payments have become an essential component of modern commerce, providing fast and secure transactions. As card payment technology advances, market behaviour and economic trends can be analysed more accurately in finer detail.
Chart 1. Monthly total value of card payments
in € million
As depicted in Chart 1, between 2022 and 2025, payments via cards show significant monthly variation. Over the past few years, there has been a positive trend with a substantial degree of cyclical seasonal fluctuations. The month with the lowest total value of card payments was February 2022 at €241 million whilst the peak occurred in August 2025 at €596 million. The seasonal fluctuations are consistent with the underlying economic and touristic rhythm of the Maltese economy. The total value of card payments consistently troughs in February and rises substantially during the core summer month of August, reflecting stable seasonal spending habits among consumers. Chart 2 shows further detail on the year-on-year growth rates.
Chart 2. Card payment growth for the peak month - August
in € million
As shown in Chart 2, the year-on-year growth rate of August is rather volatile, rising by 11% in 2023, slowing slightly to 5% in 2024 and then spiking again by 18% in 2025.
Business-to-Business (B2B) merchants typically process payments through traditional or account-based payment methods such as cheques, direct bank transfers or cash, which are not captured in the card payment data from card acquirers. As a result, a particular emphasis has been placed on the Business-to-Consumer (B2C) industries, who are client-facing by nature, in order to ensure that the data reflects the pulse of economic activity and is representative of the consumption of the Maltese and tourism population. In particular, focus has been placed on the retail industry.
Chart 3. Spending-by-card share of sales in the retail industry: 2024
Chart 3 presents a comparative pictograph illustrating card payments as a share of sales across nine retail categories. This chart allows for an immediate understanding of the intensity of each industry and its reliance on card payments. The percentage displayed on the top of the pictographs indicates the card payments as a share of sales in that category. In addition, each sphere plotted represents €2 million in sales.
‘Non-specialised stores’ (NACE G47.1), such as supermarkets, shows the highest reliance on cards, with 60% of their total sales made via card payment methods. This indicates that as of 2024, card payments are gradually approaching two-thirds of all retail sales in non-specialised stores. In another study based on survey responses from consumers in Malta, 46% answered that they preferred purchasing goods via card over other payment methods [2]. In practice, drawing on the empirical evidence presented in this article, card payments are being used more often in some specific industries. Additionally, ‘Other goods’ (NACE G47.7), comprising specialised sales of items such as books and pharmaceutical products, represents a significant 40% spending-by-card share of sales.
Given that ‘Non-specialised stores’ holds both the highest total sales among the highlighted retail groupings and the highest share of sales made by card (60%), their growth over the past three years is an element of key interest.
Table 1. Card spending metrics in Non-specialised stores (NACE G47.1)
| 2022 | 2023 | 2024 | |
|---|---|---|---|
| Median spending-by-card rate (%) | 23.9 | 30.7 | 38.8 |
| Spending-by-card share of sales (%) | 53.7 | 56.8 | 60.1 |
| Year-on-year percentage point change of spending-by-card as a share of sales (%) | - | +3.1 | +3.3 |
Table 1 shows that card payments are increasingly capturing a larger portion of total retail sales. The share increased steadily over the past three years demonstrating a sustained annual increase of 3 percentage points in both 2023 and 2024.
The median spending-by-card rate represents the midpoint of the individual merchant card-transaction share of sales, rather than a ratio derived from total sales values, and the two percentage shares differ substantially. This indicates a skewed distribution in spending-by-card rates at the merchant-level, suggesting that cards are more intensively used at merchants with higher annual sales.
Furthermore, the specific spending-by-card rate of the largest five ‘non-specialised stores’ (supermarket chains) in Malta exceeded the overall industry share (60.1%) by 5.4 percentage points, reaching 65.5% in 2024.
Figure 1. Point-of-sale and online total value of card payments by industry: 2024
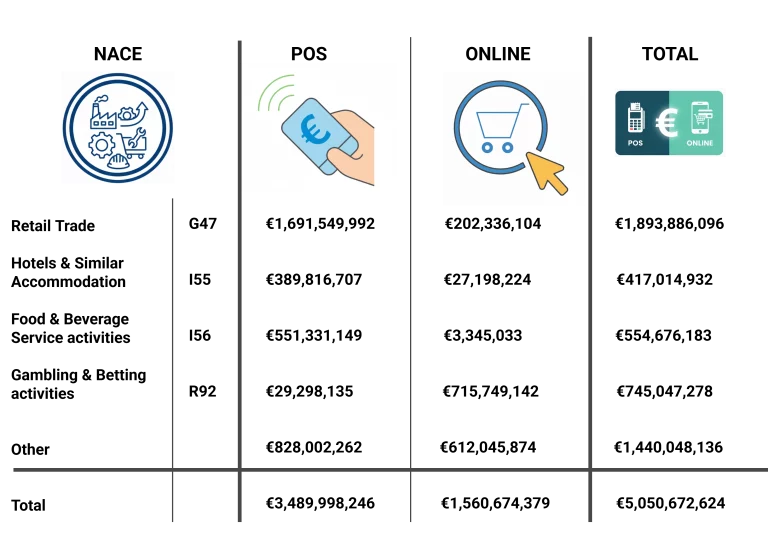
Figure 1 shows a high likelihood of payments occurring physically, with 89% of the total value of card payments being processed at the point-of-sale (POS) in the retail industry (G47). Despite many retail merchants providing an option to purchase goods or services online, the physical sales channel was nonetheless dominant.
‘Hotels and similar accommodation’ (NACE I55), another significantly large industry relevant to card payments, shows that 93% of the total value of card payments were made at POS rather than online. It is important to consider that customers often bypass local online merchants by settling accommodation fees through large digital platforms (such as Booking.com and Airbnb), which process payments in foreign jurisdictions. This phenomenon likely results in a significant understatement of the true value of online accommodation payments.
Additionally, the ‘food & beverage service activities’ (NACE I56) industry, exhibits the highest reliance on POS payments, with 99% of transactions occurring at the physical POS. This suggests that almost all card payments paid to restaurants, cafes and bars (HoReCa) were in-person. It should be noted that food delivery platforms such as Bolt and Wolt do not form part of this industry classification.
Gambling and betting activities (NACE R92) generated a total transaction value of €745.0 million. Notably, 96% of transactions were from online channels, with only a small proportion processed through the physical point-of-sale. This highlights the overwhelmingly digital nature of Malta’s gambling and betting industry, reflecting the country’s reputation for gaming operations.
Cultural factors can play a significant role in determining whether businesses adopt new technologies into their operations. Card payment data provides insights into consumer behaviour in Malta, where fuel has often been preferred to be purchased via non-card payment methods, such as cash. Hence, it’s crucial to distinguish between the merchant card acceptance rate and the overall consumer spending-by-card rate.
Figure 2. Card acceptance rate in fuel stations (grouped by annual sales): 2024
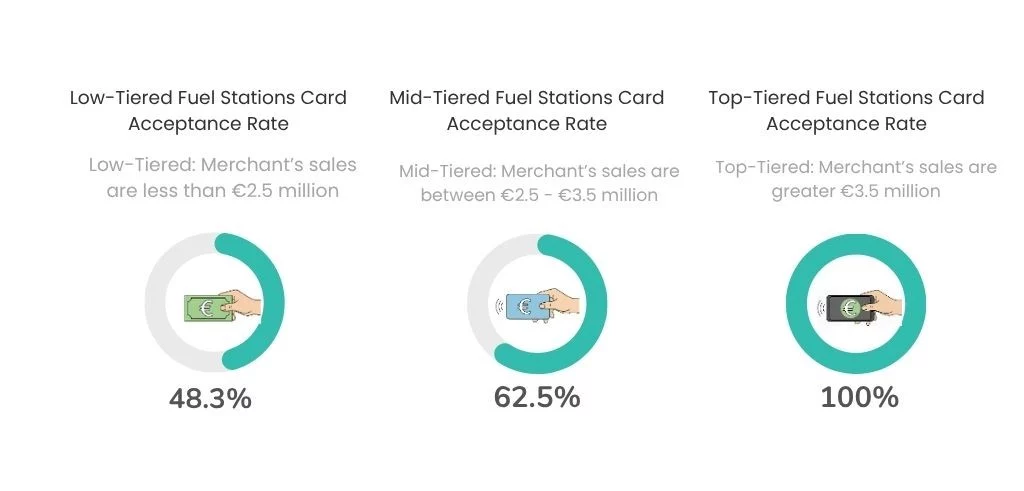
Figure 2 illustrates that low-tiered fuel stations (those with total annual sales below €2.5 million) tend to experience higher use of non-card payment methods, with only 48% offering the facility to pay via card. Conversely, all top-tiered fuel stations (with annual sales exceeding €3.5 million) offered customers the facility to pay via both card and non-card payment methods.
Chart 4. Spending-by-card share of sales in fuel stations: 2024
Chart 4 shows the spending-by-card share of fuel stations in 2024, which was a mere 30% of the total sales value. The persistence of consumers making use of non-card payment methods (70%) may not reflect the actual payment preferences of the Maltese population, but rather a habitual long-standing cultural practice in this particular industry.
To fully understand the upward trend in spending-by-card share of sales, it is essential to determine the industries with the highest concentration of purchases made via card and their distribution across different geographical districts.
Chart 5. Card payments at POS across districts by top industries: 2024
in € million
Chart 5 illustrates how the total value of card payments at POS varies significantly across geographical districts, showing a high concentration in the Northern Harbour district, known for its tourism and commercial significance, with €1.5 billion in total POS transactions. The Northern district totalled €660.6 million, slightly less than half the amount of the Northern Harbour. On the other hand, the district of Gozo & Comino totalled €184.4 million, which is more closely comparable to the Western and South Eastern districts, at €243.1 million and €240.2 million, respectively.
The composition of the total card payments across all six districts consistently features Retail (G47) as the largest contributor followed by Food and Beverage Service Activities (I56) while the third largest industry varies by district (Accommodation I55 or Wholesale Trade G46).
To understand the differences between POS transactions across localities in Malta, Map 1 presents a choropleth map, that visually highlights and details the high concentration observed in the district industry analysis of Chart 5.
Map 1. Card payments at POS by locality: 2024
The map confirms that the vast majority of the total value of card payments at POS are concentrated in the high intensity tourism or commercial localities. The Northern Harbour district, which recorded the largest total value of card payments in Chart 5, is dominated by localities falling in the highest POS transaction band (≥€150 million), including tourism-intensive localities like Tas-Sliema and San Ġiljan, as well as commercial localities like Ħal Qormi and Birkirkara.
Other localities within the Northern Harbour district also contributed significantly, with many localities, including Il-Gżira, Il-Ħamrun, L-Imsida, and others, falling within the high POS transaction band of €50 million to €150 million.
In the Northern district, Il-Mosta and San Pawl Il-Baħar recorded the highest concentration of value from card payments. As for the Southern Harbour district, Valletta was the only locality to fall within the highest POS transaction value band.
Conversely, many localities within the Gozo and Comino district fell into the lower bands of POS transactions, with the exception of the regional capital, Ir-Rabat, Għawdex. The South Eastern and Western districts were comparable to one another, both falling within the lower bands of POS transactions.
Despite the lower total value of card payments in Gozo and Comino, the proportion of merchants accepting card payments was the highest (Table 2).
Table 2. Card acceptance rate across the retail industry (NACE G47) by district
| District | Card Acceptance Rate (%) |
|---|---|
| Gozo and Comino | 67.8 |
| Northern | 63.2 |
| Northern Harbour | 61.1 |
| Southern Harbour | 59.0 |
| Western | 55.9 |
| South Eastern | 55.1 |
| Overall | 59.8 |
Table 2, which displays the card acceptance rate across districts for merchants belonging to the Retail industry (NACE 47), reveals that Gozo and Comino recorded the highest card acceptance rate at 68% in 2024. This figure is notably higher than the lowest rates found in the South Eastern and Western districts, which stand at 55% and 56%, respectively. This data indicates that while the overall value of transactions in Gozo and Comino might be smaller, the proportion of businesses equipped for card payments is the most widespread. As for the overall business population in Malta, the card acceptance rate was 60%.
Table 3. Card acceptance rate across the accommodation and food service industry (NACE I) by district
| District | Card Acceptance Rate (%) |
|---|---|
| Southern Harbour | 65.3 |
| South Eastern | 63.9 |
| Gozo and Comino | 62.8 |
| Northern | 62.7 |
| Northern Harbour | 60.3 |
| Western | 58.5 |
| Overall | 62.6 |
In 2024, card acceptance within the accommodation and food service industry (NACE I) showed little variation across districts, ranging from 59% in the Western district to 65% in the Southern Harbour. The overall rate stood at around 63%, pointing to a consistent pattern in adoption rates.
3.0 Methodology
Since the NSO gained access to micro-level card payment data in 2023, with coverage backdated to 2022, standardisation and quality assurance have been prioritised to ensure accuracy, consistency, and timely outputs. To streamline this process, the NSO developed an array of Python scripts, automating data validation and standardisation, to reduce human error and enhance the reliability of results.
3.1 Monthly total value of card payments
All transactions processed through card terminals operated by merchants were included in the dataset used to produce the time series illustrated in Chart 1. The transaction values shown in Chart 1 are expressed in € million.
3.2 Spending-by-card share of sales in the retail industry
A comparative pictograph (Chart 3) of spending-by-card share of sales in the retail industry for 2024 was created to display the intensity of each retail industry group and the percentage of spending share in the retail industry. In the pictograph, each “sphere” represents €2 million in sales. The spheres displayed in blue represent value from card payments while the grey spheres are non-card payment sales. The numerical labels below the pictographs represent the NACE Group names. The percentage above the pictograph represents the spending-by-card share of each NACE Group within the retail industry. Some merchants register card terminals under company registration numbers or other identifiers (such as VAT or ID numbers) that are no longer active. These merchant identifiers were consolidated under the corresponding active legal entity.
3.3 Card spending metrics in Non-specialised stores
The spending-by-card share of retail sales is the percentage of total value of card payments over the total sales (inc. VAT) derived from aligned administrative data. Only businesses within NACE 47.1 that have card terminals and handle both POS and online payments were considered. The median spending-by-card rate represents the midpoint of the individual merchant card-transaction share of sales, rather than a ratio derived from total sales values. The growth rates were computed by calculating the percentage change from one year to the next on the spending-by-card share of retail sales (Table 1).
3.4 Point-of-sale and online total value of card payments by industry
The data was grouped by NACE, specifically NACE G47, I55, I56 and R92 (Figure 1). It was then further grouped into sales via POS and online methods. POS transactions refer to purchases requiring a physical presence, while online transactions refer to purchases made regardless of the merchant’s location.
As for NACE I55, foreign platforms such as Booking.com and Airbnb may significantly distort the true value of online payments being made by both residents and non-residents. This cannot be captured due to the data being limited to card acquirers operating within the domestic jurisdiction. Food couriers such as Bolt and Wolt are not included in NACE I56 since they are not classified as restaurants.
3.5 Card payments at POS across districts by top industries
Data was filtered to include only card payments made at POS. The locality variable in the card data was used to obtain the merchant’s official district. Only records with an assigned NACE code from the statistical business register (SBR) were included. In Chart 5, the ‘Other industries’ category includes all other NACE codes which are present in the data for the respective district.
3.6 Card acceptance rate across districts
The merchant population used to calculate card acceptance rates by district was based on the population of VAT-registered traders in 2024. The scope was limited to active businesses classified under all industry groups of NACE G47 and I55/56, excluding entities with annual turnover below €10,000 to ensure that the indicator reflects operational traders for whom card payment infrastructure would be economically viable.
4.0 Definitions
Card acceptance rate: The card acceptance rate may be defined as the proportion of businesses that are linked with the card payment data relative to the total number of merchants within the VAT administrative records. The VAT administrative records serve as a benchmark for the measurement of such metrics due to their comprehensive and official record of all market activity, reflecting the tangible economic footprint through active businesses within the Maltese economy. This metric will allow for a conclusion to be made whether such data is suited as a proxy for market activity. The following metric can be expressed as follows:
where:
Spending-by-card share of sales: The metric described as the spending-by-card share of sales is derived to better understand actual sales proxies from card transactions. The following metric can be expressed as follows:
where:
Median spending-by-card rate (%): The metric described as Median spending-by-card rate (%) was derived to estimate the share of sales made via card payments across merchants while minimising the influence of outliers and large merchants where the high prevalence of card usage typically lifts the weighted average by total value. It is calculated by first determining the proportion of total card payment value for each individual merchant and then taking the median of these proportions across all merchants. The following metric can be expressed as follows:
where: