

Salient Points
- The number of claims in respect of non-fatal accidents at work declined slightly during the first half of 2026 compared with the corresponding period of 2025.
- Around a quarter of persons involved in non-fatal accidents at work were absent from work for between 7 and 13 days.
- Workers in elementary occupations accounted for the highest share of reported non-fatal accidents at work.
- More than 60 per cent of persons involved in the reported non-fatal accidents at work were Maltese nationals.
- Three fatal accidents at work were reported during the period January to June 2026.
Commentary
Non-fatal accidents
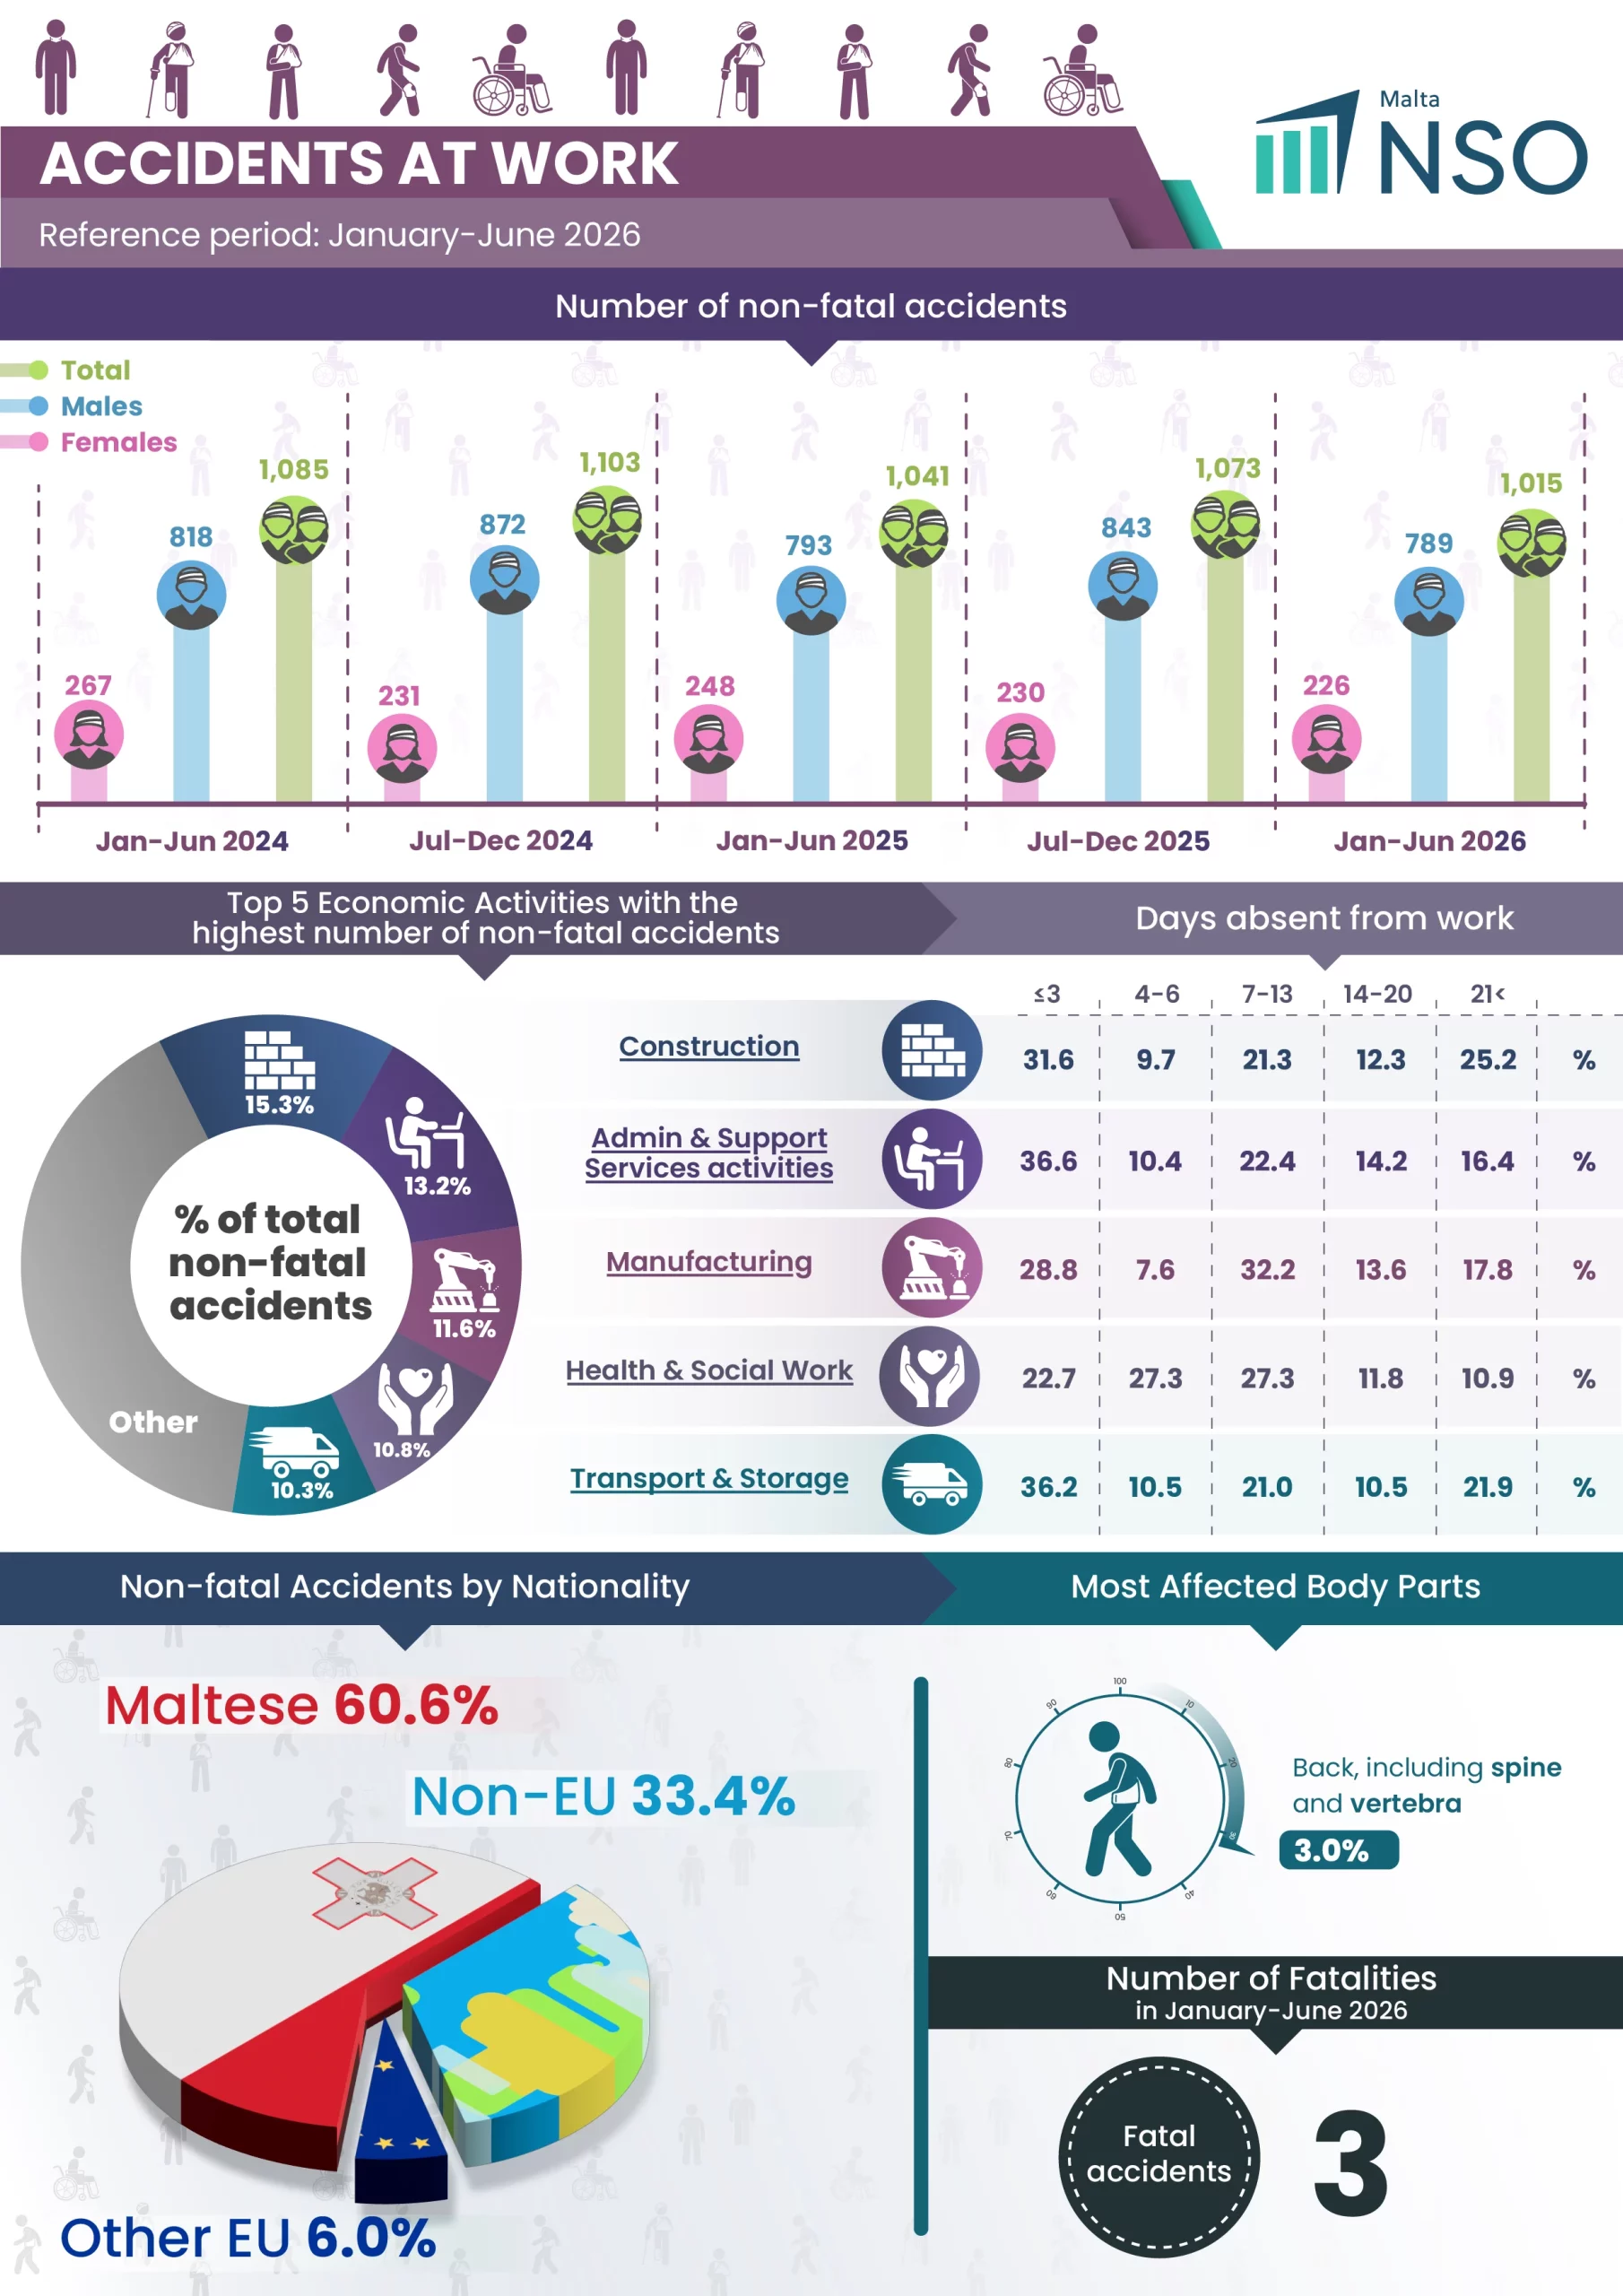
Administrative records show that 1,015 non-fatal accidents at work were reported in the first six months of 2026.
The highest number of non-fatal accidents were recorded in the Construction sector, accounting for 15.3 per cent of the total, followed by Administrative and support service activities sector at 13.2 per cent. A further 118 cases (11.6 per cent) were reported in the Manufacturing sector, while 110 cases (10.8 per cent) were recorded in the Human health and social work activities sector (Table 1). Over 25 per cent of persons involved in an accident at work were absent from work for a period ranging between 7 and 13 days (Table 2).
The largest share of reported accidents at work during the reference period involved persons employed in elementary occupations, totalling 305 cases or 30.0 per cent of all accidents, followed by craft and related trades workers, with 191 cases or 18.8 per cent of the total (Table 3). Persons aged between 25 and 44 years accounted for more than half of the accidents at work recorded during the reference period (Table 4). Over 60.0 per cent of persons involved in a non-fatal accident at work were Maltese (Table 5).
Almost one-third of injuries at work (33.0 per cent or 335 cases) affected the back, including the spine and vertebrae (Table 6). The most common types of injury were wounds and superficial injuries (64.8 per cent or 658 cases), followed by dislocations, sprains and strains (25.2 per cent or 256 cases) (Table 7).
During the reference period, 23.3 per cent of reported accidents at work occurred in enterprises employing 500 or more employees, while 22.0 per cent took place in enterprises employing between 50 and 249 workers (Table 9).
The latest available annual data show that, in 2025, the incidence rate stood at 640 non-fatal accidents at work per 100,000 employed persons. The highest standardised incidence rate was recorded in the Construction sector, followed by Manufacturing (Table 11).
Fatal accidents
Between January and June 2026, the Occupational Health and Safety Authority (OHSA) reported three fatal accidents at work (Tables 12-14). In 2025, the incidence rate of fatal accidents at work stood at 2.7 per 100,000 persons in employment (Table 15).
Tables
Non-fatal accidents at work
- xlsx Table 1. Non-fatal accidents at work by sex and economic activity of enterprise 26.64 KB
- xlsx Table 2. Non-fatal accidents at work by days absent from work and economic activity of enterprise 27.26 KB
- xlsx Table 3. Non-fatal accidents at work by sex and occupation of victim 22.82 KB
- xlsx Table 4. Non-fatal accidents at work by sex and age group of victim 21.46 KB
- xlsx Table 5. Non-fatal accidents at work by sex and nationality 21.61 KB
- xlsx Table 6. Non-fatal accidents at work by sex and part of body injured 24.52 KB
- xlsx Table 7. Non-fatal accidents at work by sex and type of injury 24.88 KB
- xlsx Table 8. Non-fatal accidents at work by sex and district of enterprise 22.26 KB
- xlsx Table 9. Non-fatal accidents by sex and enterprise size 22.71 KB
- xlsx Table 10. Non-fatal accidents by sex and employment status of victim 20.87 KB
- xlsx Table 11. Standardised non-fatal accidents at work by economic activity of enterprise 23.42 KB
Fatal accidents at work
- xlsx Table 12. Number of fatal accidents at work by main socio-demographic characteristics 21.83 KB
- xlsx Table 13. Number of fatal accidents at work by size and by economic activity of enterprise involved 21.46 KB
- xlsx Table 14. Number of fatal accidents at work by district of the accident, part of body injured, and type of injury 20.67 KB
- xlsx Table 15. Fatal occupational injuries per 100,000 workers - Incidence rates 18.76 KB
- xlsx All Tables 97.13 KB
