Tourism Intensity: 2024
- In 2024, annual tourism added an additional 46,918 persons to Malta’s mid-year resident population, bringing the effective population to 615,763.
- Due to seasonality in tourism, the effective population reached a peak of 649,546 in August 2024 and dipped to 581,720 in December 2024.
- In 2024, tourism intensity increased to 8.2 from 7.2 in 2023, meaning more tourists per 100 residents on the islands.
- During August 2024, San Ġiljan had the highest tourist population leading to a tourism intensity of 126.4 – meaning 126 tourists were present for every 100 residents.
Tourism Intensity: 2024
Tourism intensity
In 2024, the usual resident mid-year population was estimated at 568,845. When accounting for the presence of tourists, on average over the entire year, this increased by 46,918, reaching an effective population of 615,763 (Table 1). Due to the seasonal nature of tourism, the effective population fluctuates on a monthly basis. While keeping the resident population count constant to the value of the mid-year estimate, during the lowest tourism month (December), the effective population stood at 581,720 (12,875 tourists).
During the peak tourism month (August), the effective population increased by an additional 80,701 tourists reaching 649,546. This is a difference in the effective population of 67,826 (11.7 per cent) between the highest and lowest tourism months in 2024 (Table 1, Chart 1).
Chart 1. Mid-year resident population and effective population by month
Reference year: 2024
The impact of the tourist population on the resident population can be expressed in terms of tourism intensity. Tourism intensity is here defined as the ratio of nights spent at all forms of tourist accommodation per 100 residents per day. Annual tourism intensity was 8.2 in 2024, meaning that for every 100 residents there were approximately eight tourists. This is an increase of one tourist for every 100 residents when compared to 2023. Seasonality has a marked impact on tourism intensity. In 2024, tourism intensity reached 14.2 in August, while in December it was 2.3. This means that in the peak tourism month there were nearly 12 more tourists per 100 residents compared to the month with the least tourism (December) (Table 1).
Apart from varying seasonally, tourism intensity also varied geographically. The Northern Harbour district was the largest district in terms of the mid-year resident population and had the largest average annual tourist population. In turn, it had the largest effective population in 2024. When considering tourism intensity however, the Northern district surpassed the Northern Harbour district at a value of 14.8 compared to 13.7, meaning that there was approximately one more tourist per 100 residents in the Northern district compared to the Northern Harbour district (Table 2, Map 1).
Map 1. Tourism intensity by district
Reference year: 2024
Geographical variations become more pronounced when analysing tourism intensity at the locality level. San Ġiljan had the highest tourism intensity in 2024 with almost 80 tourists for every 100 residents (79.9), this was followed by Valletta (69.4). When comparing to the previous year, Valletta had the largest increase in terms of tourism intensity, from 53.5 to 69.4. This means that, in Valletta, in 2024 there were nearly 16 more tourists for every 100 residents compared to 2023 (Table 4).
The impact of the tourist population can also be measured in terms of the size of the geographical area. Population density measures the number of persons per kilometre squared and the impact of tourism on population density can be assessed by calculating density using the effective population. The total mid-year resident population density in 2024 was 1,806 residents per kilometre squared. When considering the average annual tourist population this increased to 1,954 persons per kilometre squared. At the district level the most pronounced impact is seen in the Northern Harbour district. The mid-year resident population density in 2024 was 7,503 residents per kilometre squared, when considering the average number of tourists in 2024 in this district, this increased by slightly over 1,000 persons for every kilometre squared, reaching 8,527 (Table 3).
Among localities experiencing the highest tourism volumes, population density increased notably when considering the tourist population. The resident mid-year population density in Tas-Sliema in 2024 was 17,148 residents per kilometre squared, this increased to 23,929 persons per kilometre squared when accounting for the average annual tourism population in the locality. While San Ġiljan had a lower effective population density value compared to Tas-Sliema in 2024 (16,450), it had the largest increase in absolute terms when considering the number of additional persons per kilometre squared – 7,308 persons (Table 5).
Seasonal differences in the top tourism localities
During the peak month of August, San Ġiljan had the highest tourism intensity, reaching 126.4 tourists for every 100 residents, a slight decrease compared to 2023. Valletta followed with a tourism intensity of 82.0, an increase of 5.5 over the previous year (Table 6, Map 2).
Map 2. Tourism intensity in top 6 tourism localities in August 2024
Reference month: August 2024
In terms of effective population during the peak month, San Pawl Il-Baħar’s estimate stood at 58,155, followed by Tas-Sliema with 35,476, increases of 12.9 and 4.7 per cent over 2023, respectively (Table 6, Map 3, Chart 2).
In the low tourism month of December, tourism intensity was highest in Valletta, though considerably lower than the value seen in August (49.5) (Table 8, Chart 3).
Map 3. Effective population in top 6 tourism localities in August 2024
Reference month: August 2024
Chart 2. Mid-year resident, tourist and effective populations in top 6 tourism localities
Reference month: August 2024
Chart 3 Tourism intensity in top 6 tourism localities
Reference months: August and December 2024
Population density in the peak tourism month of August increases considerably in localities experiencing high tourism volumes. Tas-Sliema had the highest population density in 2024 when considering the tourist and resident population at 27,374 persons per kilometre squared. This is an increase of over 10,000 people per kilometre squared on top of the resident population. While the overall effective population density in August was lower in San Ġiljan than in Tas-Sliema, the increase in density was larger, with an additional 11,553 persons per kilometre squared. Population density remained the highest in Tas-Sliema in the low tourism month of December though the increase in population density when accounting for tourists was approximately three times less than in August (Table 8, Chart 4).
Chart 4. Mid-year resident, August and December effective population density in top 6 tourism localities
Reference year: 2024
Tables
Tables
Methodological Notes
- Conceptual definitions:
● Tourist population: The number of tourists per day in a given time period (month, quarter or year) and geographical area, after accounting for outbound tourists. Refer to conceptual definition outbound tourist correction for further details. Totals of the tourist population may not match exactly across different time periods because the figures are estimated as an average per day within each specific period. Therefore, summing the averages from smaller periods—such as quarters—to get a yearly total will not equal the estimate calculated over the entire year. Totals also may not tally across geographical area breakdowns – refer to note locality of longest stay for more details.
● Outbound tourist correction: Since Maltese residents travel abroad at the same time as inbound tourists arrive, the tourism figures are adjusted to reflect this. Outbound tourist nights data for the applicable time period (month, quarter, or year) are extracted from TOURSTAT. This data are then distributed by locality using the harmonized distribution of outbound tourists by locality and district from the National Tourism Survey (NTS). An estimate of the net tourists nights was then calculated by subtracting the outbound tourist nights from the inbound estimates. Note that since the NTS only covers the population aged 15 and over, a small discrepancy may exist in the corrected figures.
● Locality of longest stay:
a. The locality of longest stay, as collected by the TOURSTAT survey, is being used as the reference locality.
b. The locality of longest stay is the locality in which the tourists have spent most of their nights while in MALTA. If a tourist stays in multiple localities during their stay, all nights are assigned to the locality where they spent most of their nights.
E.g. An inbound tourist spends a total of 10 nights in MALTA: 8 in San Ġiljan, and 2 in Valletta. The locality of longest stay is San Ġiljan, and all 10 nights are attributed to this locality.
c. In some cases, no primary locality is specified, such as when a person stays in a different location each night. When compiling estimates at lower geographical breakdowns, such as locality, these cases are excluded. However, for country-level data, all inbound tourist nights are included. As a result, totals for estimates broken down by geographic areas may not match the country-level totals presented across different tables.
● Geographical information
a. The 68 localities are grouped into 6 districts (local administrative units) – Southern Harbour, Northern Harbour, South Eastern, Western, Northern and Gozo and Comino. More details on how the localities are grouped can be found from the Districts (Local Administrative Unit).
b. The areas, in km2, used for the calculation of all population density estimates are as tabulated below:
| Malta |
|---|
| 315.0 |
| Southern Harbour | Northern Harbour | South Eastern | Western | Northern | Gozo & Comino |
|---|---|---|---|---|---|
| 26.2 | 24.0 | 50.1 | 72.4 | 73.6 | 68.7 |
| San Ġiljan | San Pawl il-Baħar | Tas-Sliema | Il-Mellieħa | Il-Gżira | Valletta |
|---|---|---|---|---|---|
| 1.6 | 14.5 | 1.3 | 22.6 | 1.0 | 0.8 |
● Usually resident population: Refers to all persons who have their usual residence in a Member State at the reference time.
● Usual residence: Refers to the place where a person normally spends the daily period of rest, regardless of temporary absences for purposes of recreation, holidays, visits to friends and relatives, business, medical treatment or religious pilgrimage. Usual residents of a specific geographical area are:
i. Those who have lived in their place of usual residence for a continuous period of at least 12 months before the reference time; or
ii. Those who arrived in their place of usual residence during the 12 months before the reference time with the intention of staying there for at least one year.
● Mid-year population: Calculated by averaging start-of-the-year and end-year usual resident population estimates. The estimate would be the average population as at the end of June.
2. Variable Definitions:
● Time period (t): Number of days in the given time period under consideration. E.g. If the month August is being analysed, t = 31.
● Area (A): The area in the locality/district/region under review.
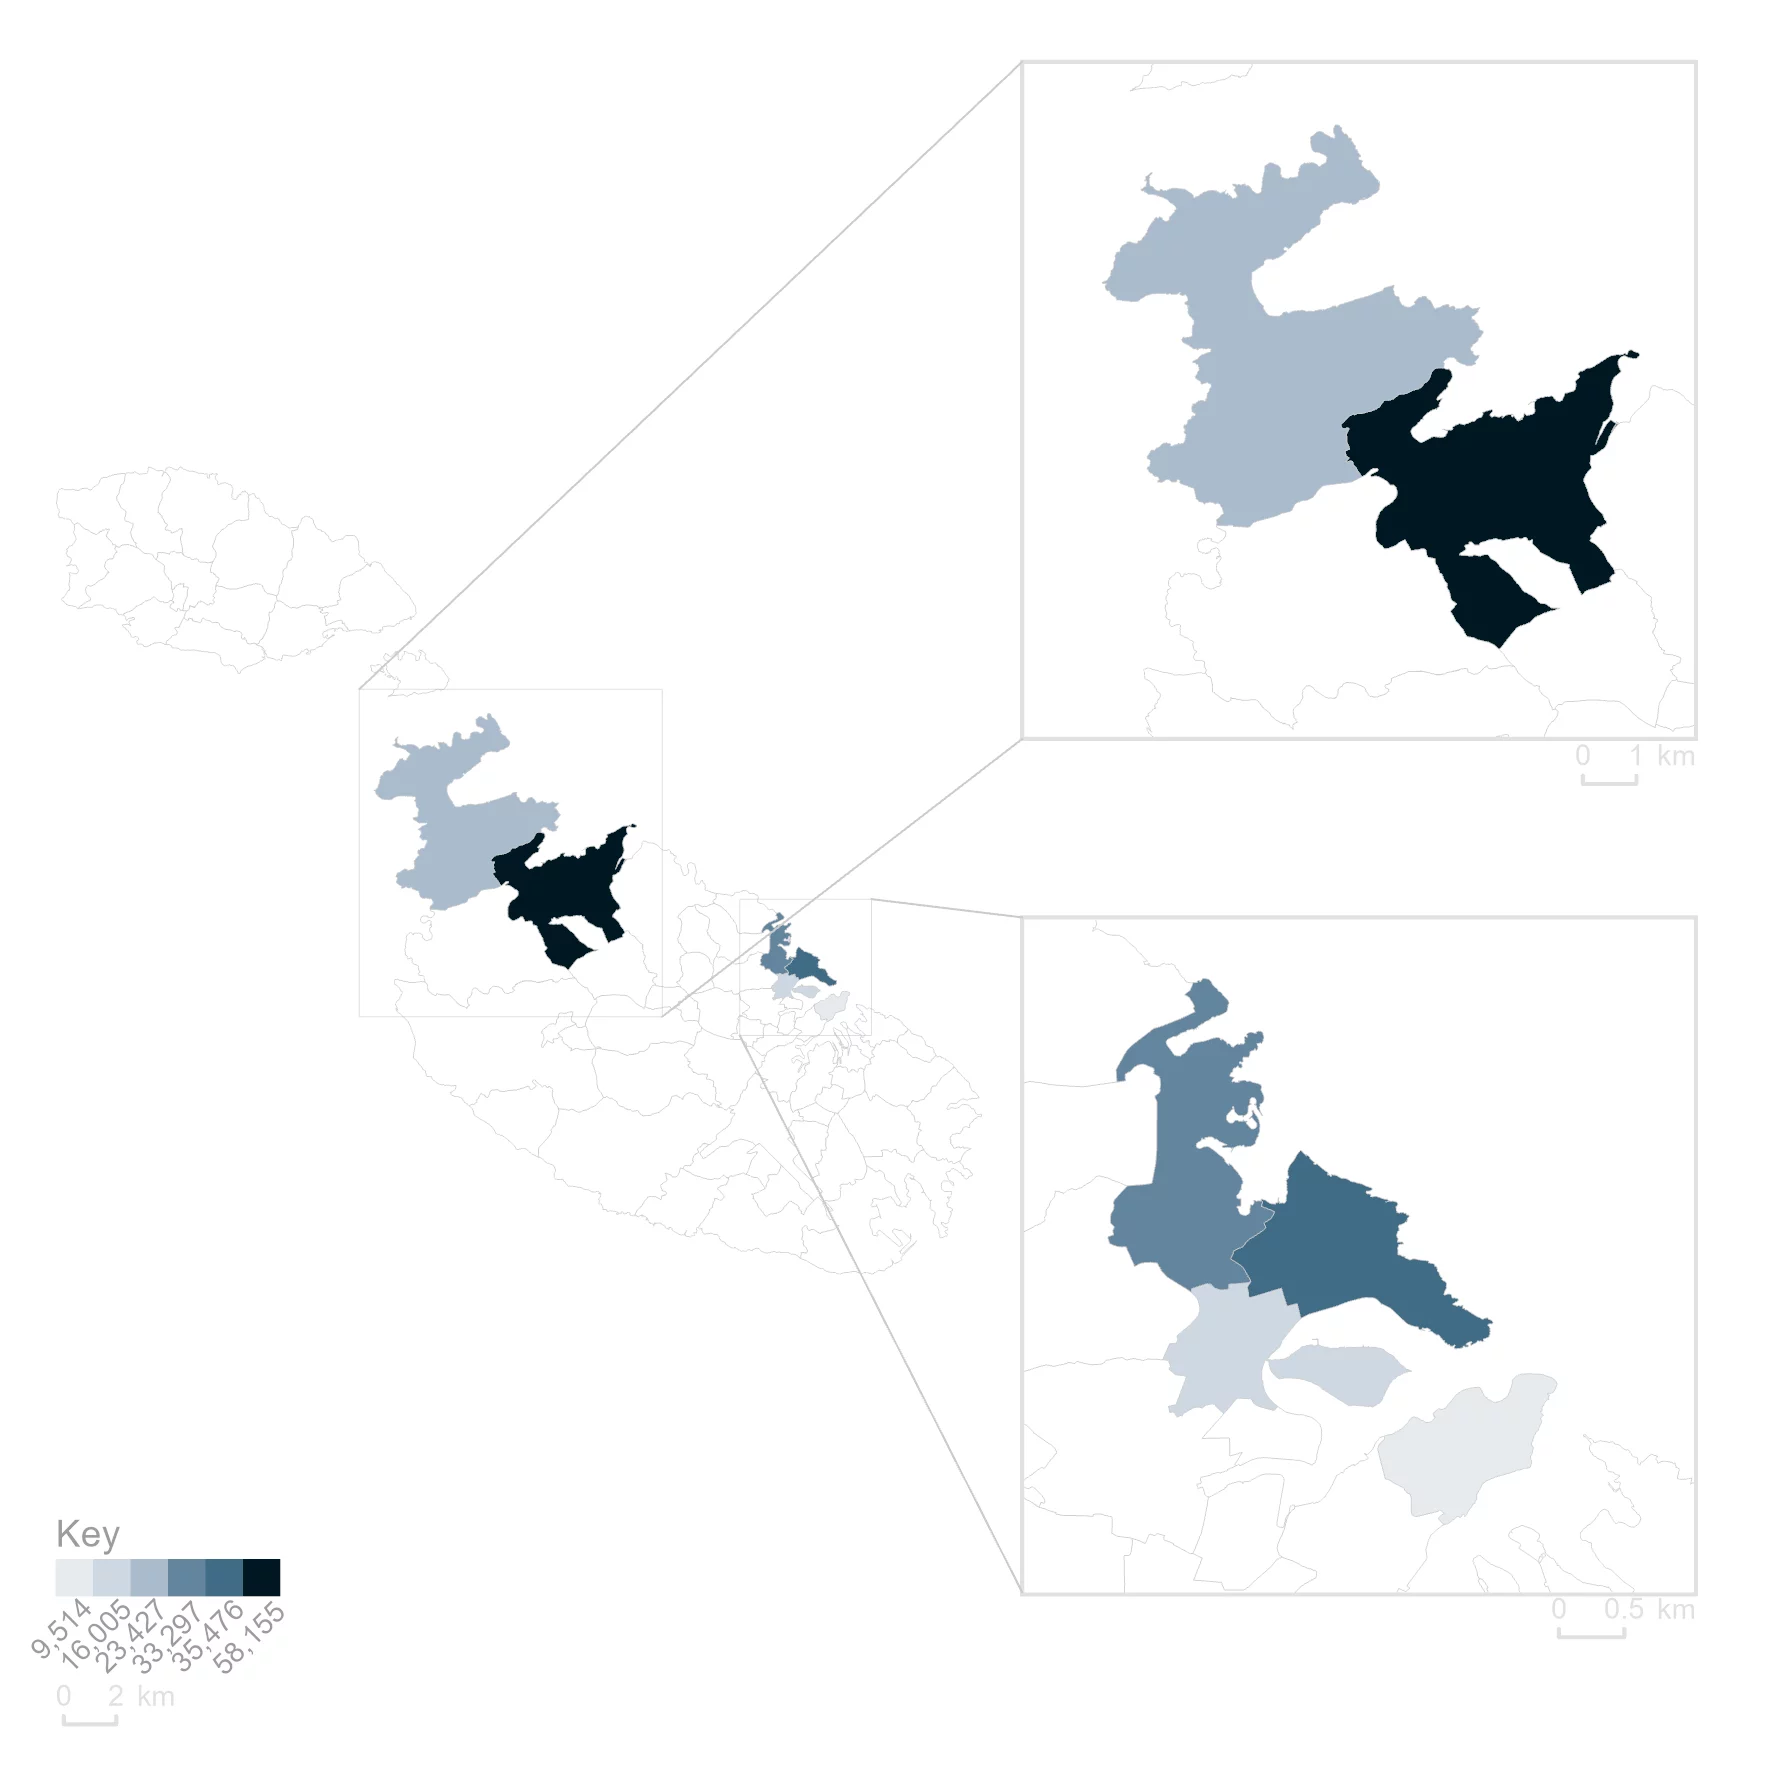
● Mid-year population (P mid): The average of the beginning and end-year estimation of the number of residents in the locality/district/region under review.
● Tourist nights (tourn): Number of tourist nights in a given time period (t) and in the locality/district/region under review.
● Tourist nights per day (tournpd): The effective number of tourists per day over a given time period (t) and in the locality/district/region under review. This figure takes into account outbound tourism. This figure is also referred to as the tourist population.
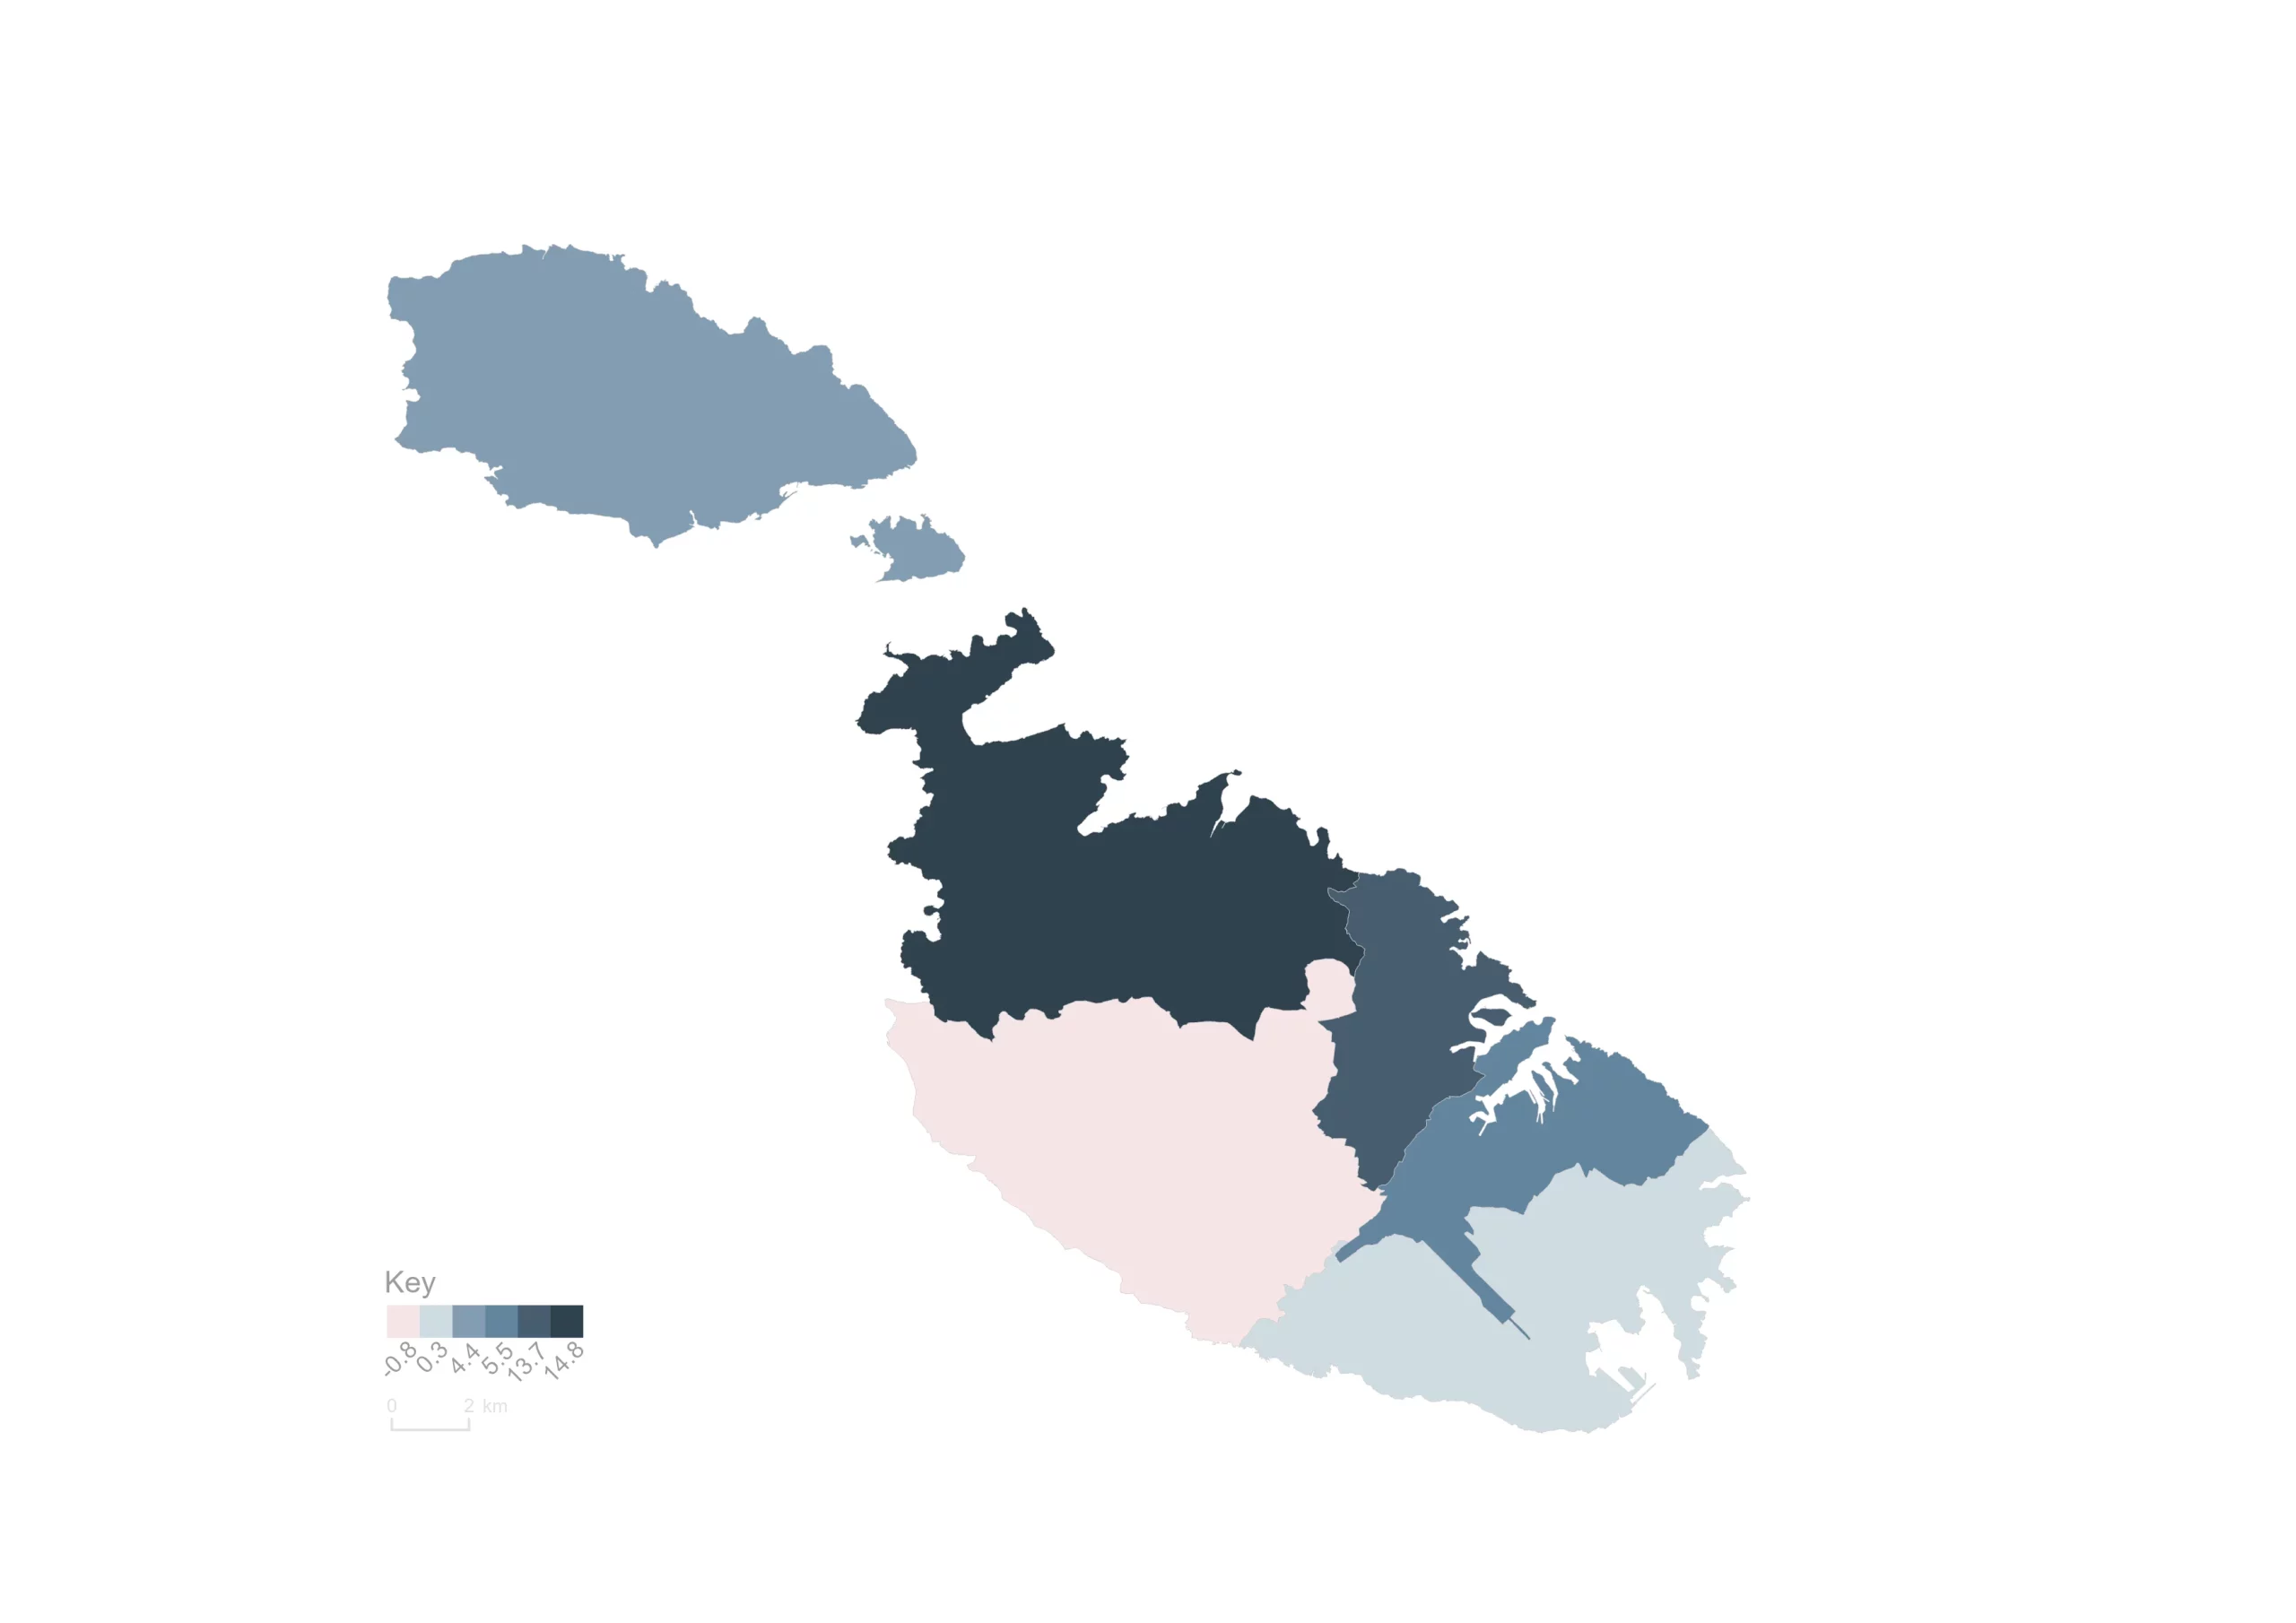
● Tourism intensity (Ti): The number of tourist nights in all forms of accommodation (rented and non-rented) per 100 residents per day, in a given time period (t) and in the locality/district/region under review. The superscript inbound and outbound distinguishing between the two tourism populations.
● Tourism density (Td): The number of tourist nights in all forms of accommodation (rented and non-rented) per day per km2, in a given time period (t) and in the locality/district/region under review.
● Effective population (Peff): The mid-year population plus the tourist nights per day in a given time period (t) and in the locality/district/region under review.
3. Equations:
(1) ![]()
(2) ![]()
(3) ![]()
(4) ![]()
4. Data Sources:
| Component | Source | Metadata |
|---|---|---|
| Inbound and Outbound tourist nights data by date of departure. | TOURSTAT Survey - Living Conditions and Tourism Unit | https://nso.gov.mt/themes_sources___met/tourstat-survey/ |
| Outbound tourist locality of residence information by month of departure. | National Tourism Survey - Living Conditions and Tourism Unit | https://nso.gov.mt/themes_sources___met/national-tourism-survey/ |
| Mid-year population estimates | Population and Migration Unit | https://metadata.nso.gov.mt/reports/DEMOREG_SIMS_2021.pdf |
5. The locality of residence for outbound tourists is obtained from the National Tourism Survey (see note outbound tourist correction). However, the survey’s reference period is the quarter of arrival, whereas for consistency with TOURSTAT data (which provides tourist nights), the quarter of departure is required. Consequently, data from more recent rounds of the National Tourism Survey may include tourists who departed in previous quarters of 2023 and were not captured in the data used at the time of analysis. Estimates produced by geographical breakdown for 2023 were therefore revised to adjust for the locality distribution available in the most recent data from the National Tourism Survey.
2023 figures have been revised when compared to those figures published in the Tourism Intensity Statistical Insight.
6. A detailed news release calendar is available online.
7. References to this news release are to be cited appropriately. For guidance on access and re-use of data please visit our dedicated webpage.
8. For further assistance send your request through our online request form.
