Tax Revenues: 2024

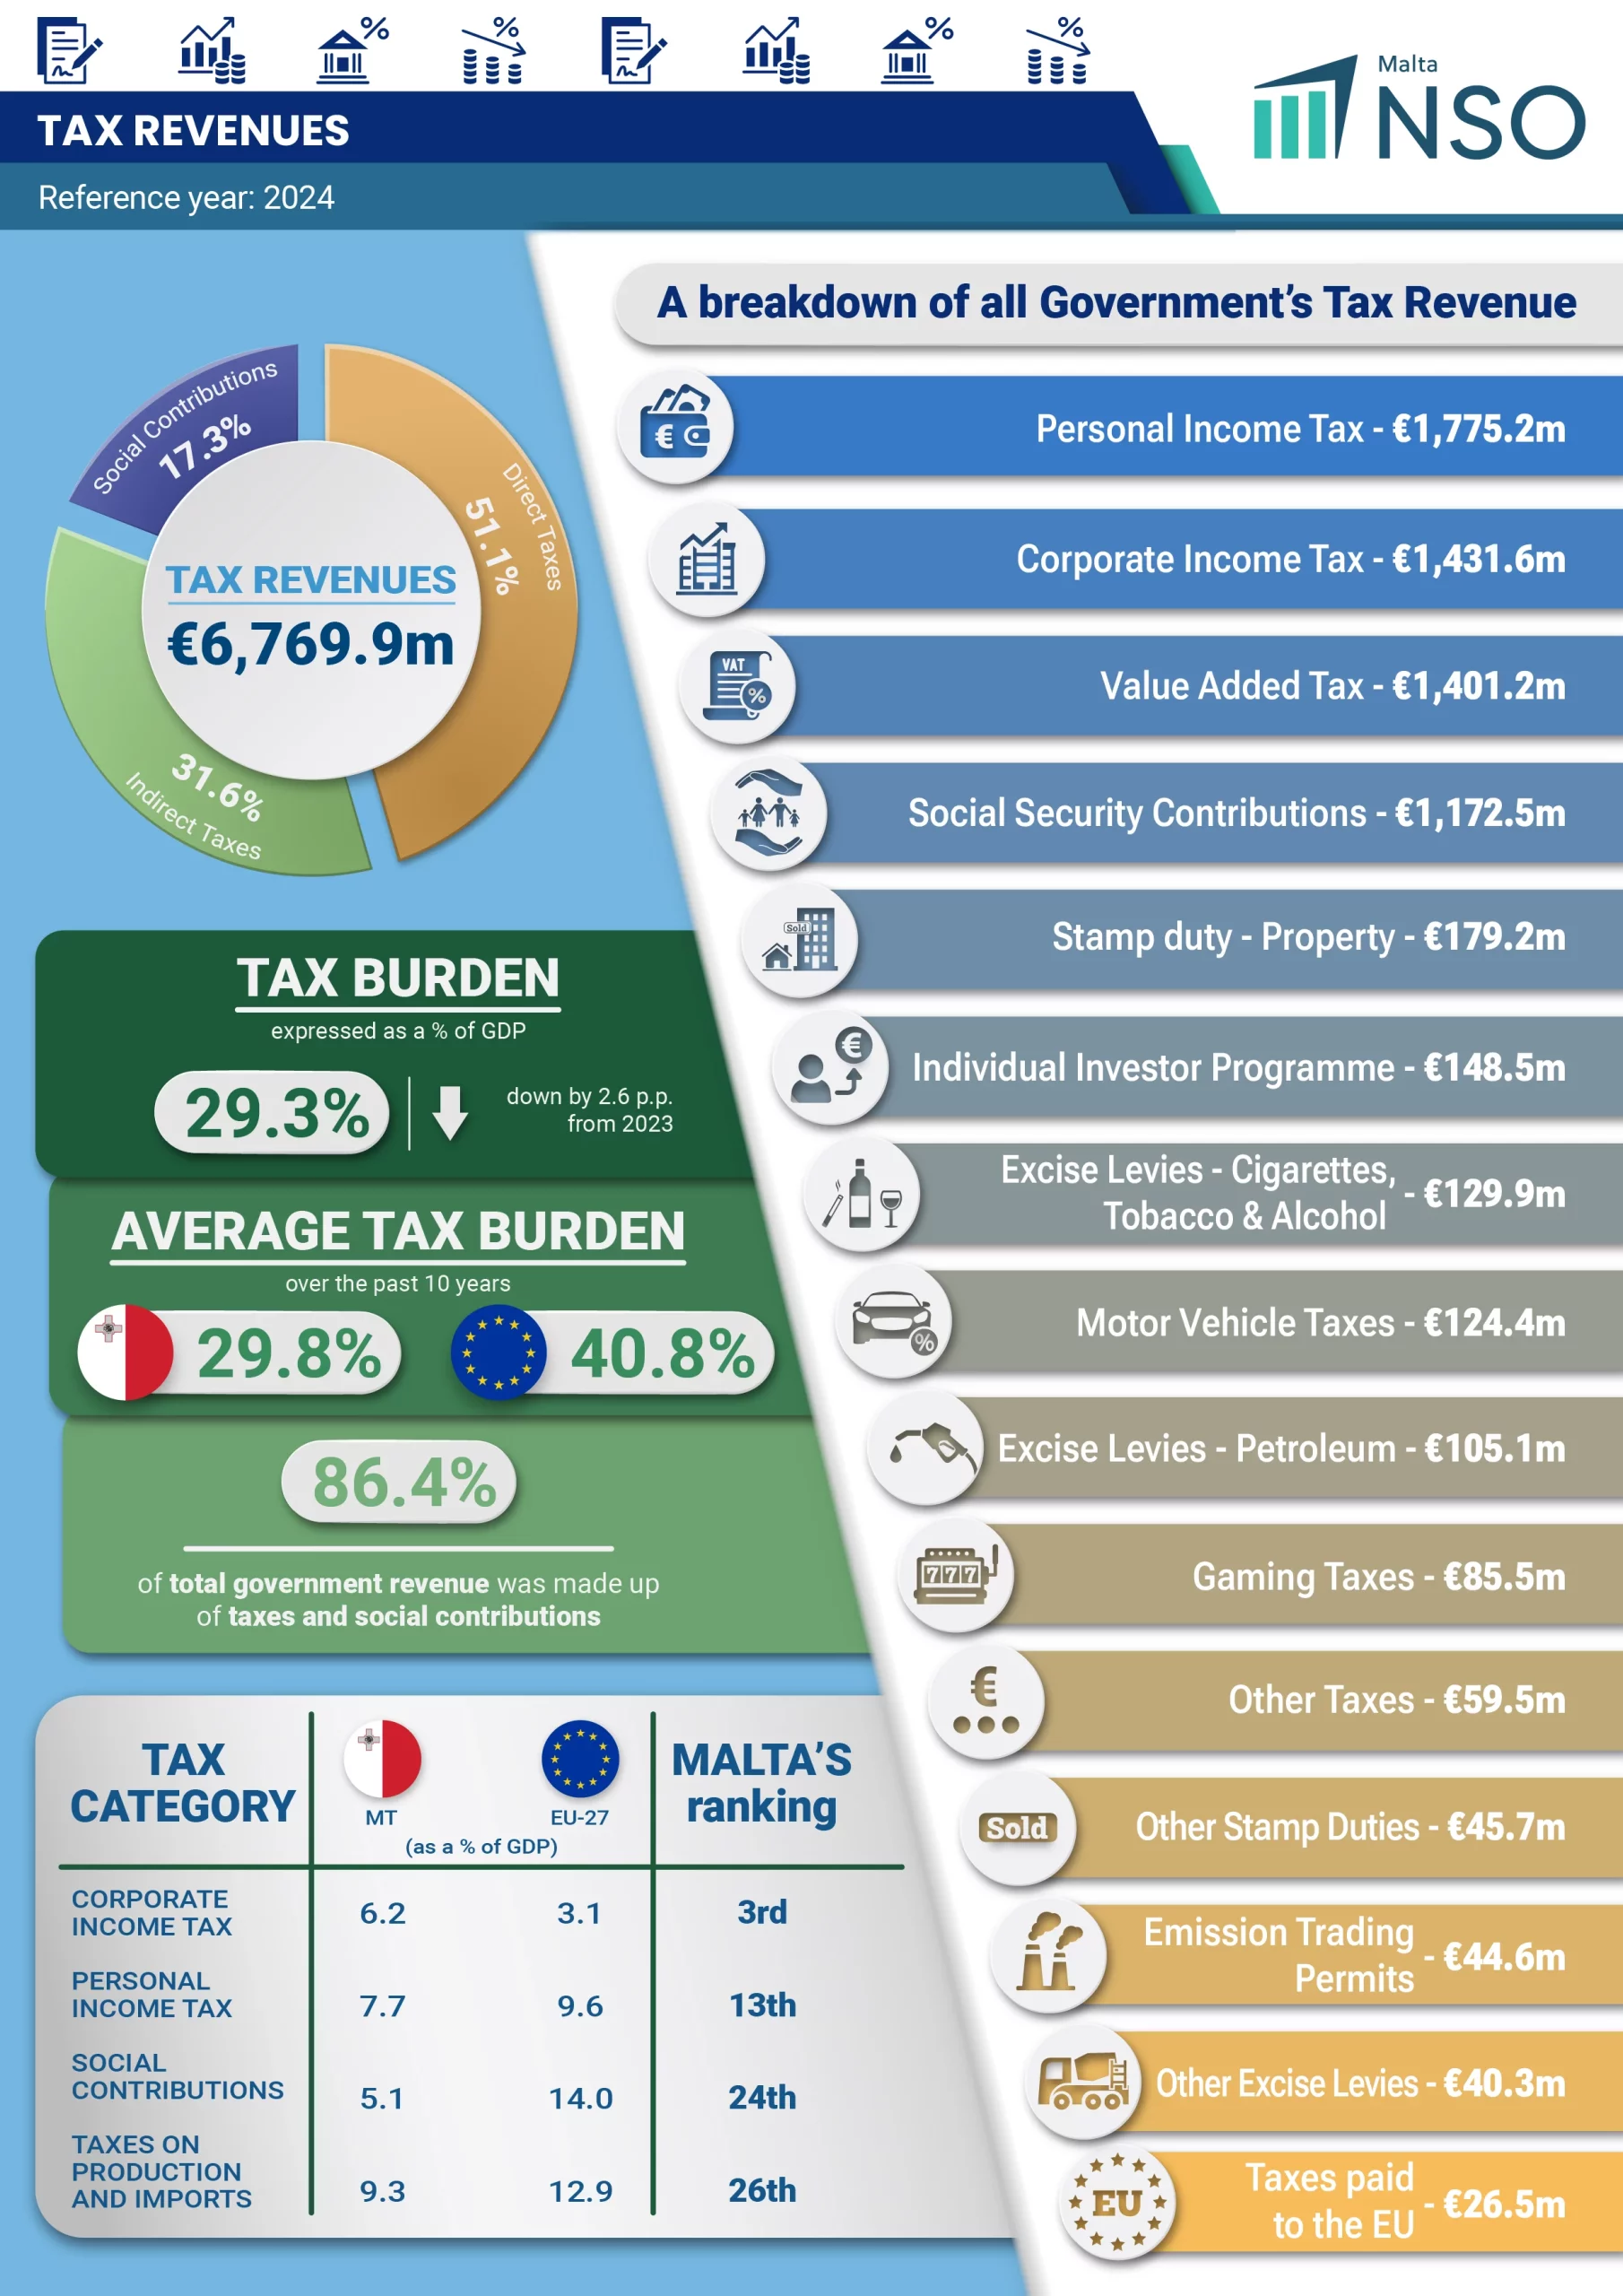
- In 2024, total tax revenue increased by €1,179.0 million over 2023, reaching €6,769.9 million. Direct and indirect taxes increased by €908.6 million and €166.1 million, respectively, while social security contributions rose by €104.4 million.
- Corporate Income tax increased by €588.6 million over 2023, while Personal Income Tax Rose by €238.1 million.
- Malta’s tax burden reached 29.3 per cent of GDP, up by 2.6 percentage points from 26.7 per cent in 2023.
- The Household sector contributed for 55.4 per cent of the General Government’s income tax, totaling €1,775.2 million, while Non-Financial and Financial Corporations contributed 22.6 per cent and 21.7 per cent, respectively.
- Malta’s total environmental taxes rose by €1.0 million in 2024 to €312.5 million, with Energy taxes making up €156.2 million of this total.
Tax Revenues: 2024
Tax Revenues: 2024

Tax revenues increased by €1,179.0 million over the previous year, reaching a total of €6,769.9 million. This figure accounted for 86.4 per cent of total general government revenue in 2024.
All main categories of tax revenue recorded growth, with direct taxes remaining the largest component, followed by indirect taxes and social contributions.
Direct taxes totalled €3,457.5 million, making up 51.1 per cent of the overall tax revenue. This marked an increase of €908.6 million over the previous year. The primary component within this category remains the Personal Income Tax, which rose by €238.1 million, reaching €1,770.7 million. Corporate Income Tax registered a significant increase of €588.6 million, standing at €1,424.7 million.
Indirect taxes amounted to €2,139.9 million, an increase of €166.1 million when compared to 2023, and represented 31.6 per cent of total tax revenue. Within this category, the Value Added Tax (VAT) component stood at €1,401.2 million, up by €132.4 million from the preceding year. Moreover, Taxes on Products totalled €594.2 million, an increase of €31.9 million compared to 2023. This increase was mainly attributable to higher tax revenue generated from duty on documents and gaming taxes1. Other Taxes on Production increased by €4.1 million, reaching €117.9 million in 2024.
Social contributions2, which include payments by employers, employees, as well as self- and non-employed persons accounted for 17.3 per cent of the total tax revenue in 2024, amounting to €1,172.5 million. This reflects an increase of €104.4 million when compared to the preceding year (Table 1).
The overall tax burden represents the total amount of taxes and social contributions, expressed as a percentage of Gross Domestic Product (GDP). Malta’s total tax burden stood at 29.3 per cent in 2024, an increase of 2.6 percentage points over the 26.7 per cent recorded in 2023. The data shows an average tax burden of approximately 30.3 per cent for the period between 1995 and 2024. This indicates a relatively stable tax environment during these years, with variations around this average, including values ranging from as low as 25.5 per cent and as high as 34.0 per cent. (Table 2, Chart 1).
By the end of 2024, direct taxes (which also include Capital taxes) accounted for 15.0 per cent of GDP, an increase of 2.8 percentage points compared to 2023. Indirect taxes represented 9.3 per cent of GDP, while the share of social contributions made up 5.1 per cent of GDP (Table 2, Chart 2).
Chart 1. Overall tax burden by year
Chart 2. The evolution of the main tax components in Malta
as a percentage to GDP
Income Tax receipts by ESA 2010 institutional sector
In 2024, the Household sector contributed more than half of the income tax collected by the general government, accounting for 55.4 per cent of the total, equivalent to €1,775.2 million. Contributions from the Non-Financial Corporations and Financial Corporations represented 22.6 per cent and 21.7 per cent, respectively. Non-profit Institutions serving Households, General Government and the Rest of the World collectively made up the remaining 0.4 per cent of the total.
In absolute terms, income tax receipts increased by €829.4 million over 2023, primarily driven by higher receipts from Financial Corporations (€302.6 million) and Non-Financial Corporations (€279.5 million). Income tax paid by Households also rose significantly, increasing by €238.9 million during the year (Table 4).
Environmental taxes
In 2024, total environmental tax revenue increased marginally by €1.0 million, reaching €312.5 million. This figure represents 4.6 per cent of total revenue collected from all taxes and social contributions, and 1.4 per cent of GDP. Energy taxes (which include taxes on transport fuels) constituted the largest share of environmental taxes and increased by €5.0 million, mainly due to higher revenue from emission trading permits (€4.5 million). This increase was partly offset following a decrease in revenue generated from Transport taxes (Table 5).
1 Further information is available in Malta’s National Tax List (Table 6).
2 Refer to methodological note 4.
Methodological Notes
1. All data in this news release is in line with the European System of Accounts (ESA) 2010 Manual (ISBN 978-92-79-31242-7). This system of accounts is mandatory for all EU Member States.
2. Total tax revenue is made up of taxes received by the Central Government (S.1311) (which consists of Government Ministries and Departments and the Extra Budgetary Units) and the EU Institutions (S.212). The taxes that are reported represent ‘ultimately received’ tax revenues including the ‘own’ taxes paid to the EU.
3. The tax-to-GDP ratio measures the overall tax burden as the total amount of taxes and social contributions as a percentage of GDP. GDP figures for 2021-2024 are in line with the latest GDP news release no. 155/2025 published on 28 August 2025.
4. The Social Contributions figure includes also the Imputed Social Contributions (D.612). These represent the counterpart to social benefits paid directly by employers to their employees or former employees and other eligible persons. In Malta’s case, these refer to Treasury Pensions.
5. An environmental tax is a tax whose tax base is a physical unit (or a proxy of it) of something that has a proven, specific negative impact on the environment, and which is defined in the European System of Accounts (ESA 2010). The environmental taxes feature in Taxes on Products (D.214), Other Taxes on Production (D.29) and Other Current Taxes (D.59).
6. Revenues from VAT, Income Tax and Social Security Contributions are recorded using the time-adjusted cash method. Following a study undertaken by NSO in 2008, Eurostat approved a time adjustment of t+1 for VAT and t+2 for Income Taxes and Social Security Contributions.
7. For additional information on the taxes in Malta refer to the “Taxes in Europe” database which contains, for each individual tax, information on its legal basis, assessment base, main exemptions, applicable rate(s), economic and statistical classification, as well as the revenue generated by it. The “Taxes in Europe” database is the European Commission’s online information tool covering the main taxes in force in the EU Member States (IP/07/662). The system contains information on around 650 taxes, as provided to the European Commission by the national authorities. Access is free for all users at: Taxes in Europe Database.
8. All data in this release should be considered as provisional and therefore subject to revision. Figures may not add up due to rounding.
9. More information relating to this news release may be accessed at:
10. A detailed news release calendar is available online.
11. References to this news release are to be cited appropriately. For guidance on access and re-use of data please visit our dedicated webpage.
12. For further assistance send your request through our online request form.