Salient Points
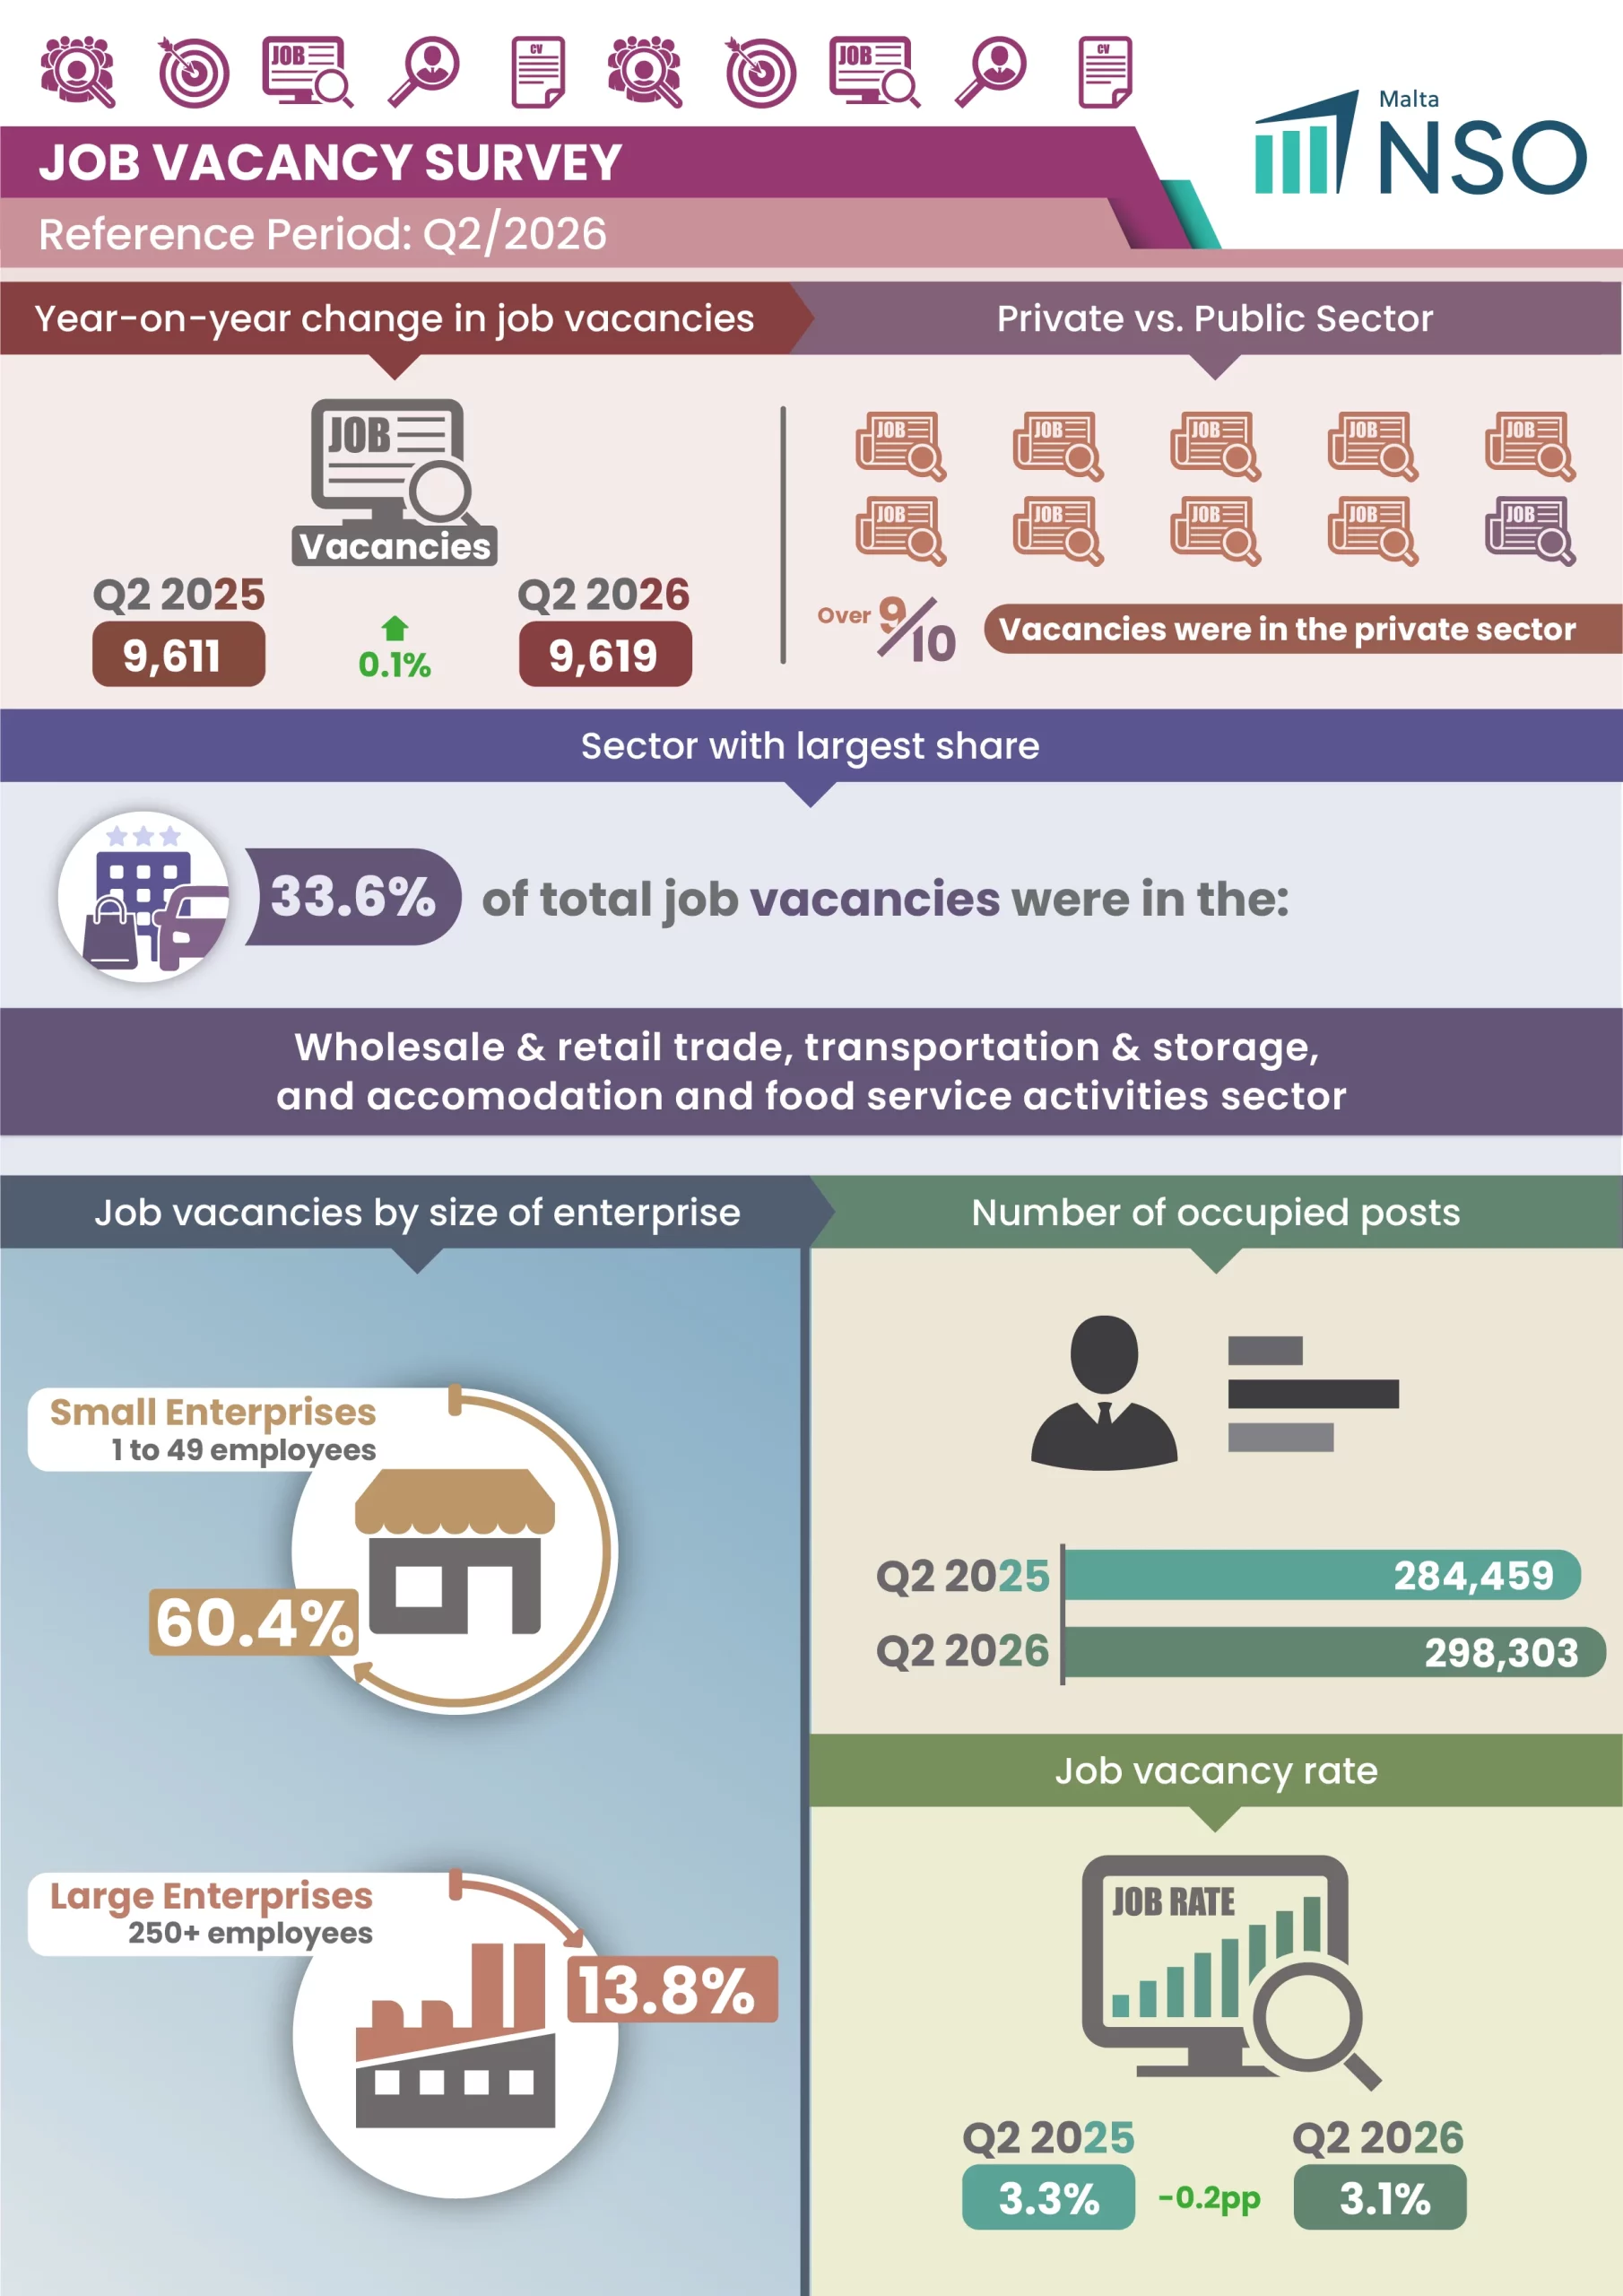
- In the second quarter of 2026, there were a total of 9,619 vacancies.
- The wholesale and retail trade, transportation and storage, accommodation and food services activities along with the professional, scientific, technical, administration and support service activities, generated more than half of all vacancies during the second quarter of 2026.
- Small enterprises with 1–49 employees accounted for 60.4 per cent of all vacancies, while those employing 250 or more persons generated 13.8 per cent.
- The private sector dominated the job vacancy market, representing 96.0 per cent of all vacant positions, with the public sector accounting for the remaining 4.0 per cent.
Commentary
The NACE classification system, the Statistical Classification of Economic Activities in the European Community, has been updated to NACE Rev. 2.1. Further information on this reclassification is available in the press information notice published on 28 April 2026. More information is available in methodological note 6.
This news release presents the findings of the Job Vacancy Survey (JVS), a quarterly enterprise-based enquiry that provides insights into the demand for labour by measuring the number of vacancies and occupied posts.
Job Vacancies
In the second quarter of 2026, there were a total of 9,619 vacancies within enterprises employing one or more persons, registering an increase of 0.1 per cent over the same period in 2025 (Chart 1, Table 1).
The wholesale and retail trade, transportation and storage, accommodation and food services activities along with the professional, scientific, technical, administration and support service activities, generated more than half of all vacancies during the second quarter of 2026. On the other hand, the real estate activities recorded the lowest number of job vacancies, standing at 2.2 per cent of the total number of calls for application in Q2 2026 (Chart 2, Table 1).
The highest year-on-year increase in the number of job vacancies was recorded within the wholesale and retail trade, transportation and storage, accommodation and food services activities, with an addition of 571 vacancies totalling to 3,236 vacancies. This was followed by the construction sector, which saw an increase of 342 vacancies. On the contrary, professional, scientific, technical, administration and support service activities, experienced the largest drop when compared to the second quarter of 2025, with a reduction of 541 vacancies (Table 1).
Data also shows an inverse relationship between enterprise size and the number of job vacancies. In this regard, small enterprises (1 to 49 employees) contributed to 60.4 per cent of the vacancies whereas companies with 250 employees or more generated 13.8 per cent of all vacancies of the second quarter of 2026 (Chart 3, Table 2).
In the private sector, job vacancies increased by 329 between the second quarter of 2025 and the second quarter of 2026, totalling to 9,239, whereas within the public sector, the total for the same period stood at 380 (Table 3). As Chart 4 illustrates, the private sector continues to dominate the job vacancy market, representing 96.0 per cent of all vacancies, leaving the public sector with a 4.0 per cent share (Chart 4).
Occupied Posts
During the second quarter of 2026, the total number of occupied posts within enterprises employing one or more employees stood at 298,303 (Chart 1, Table 4). Over one half of these posts were recorded in wholesale and retail trade, transportation and storage, accommodation and food service activities and in public administration, defence, education, human health and social work activities. Over a period of one year, public administration, defence, education, human health and social work activities followed by the arts, entertainment and recreation; other service activities sector, registered a growth of 12.3 and 6.6 per cent respectively, (Table 4). During the second quarter of 2026, 39.4 per cent of occupied posts were estimated to be in enterprises employing 250 employees or more. Units with 50 to 249 employees made up slightly more than one fourth of all occupied posts (Table 5).
Occupied posts within the private sector stood at 238,531 garnering 80.0 per cent of the total amount of jobs. The public sector totalled 59,772, making up the remaining 20.0 per cent (Table 6).
Job Vacancy Rate
In the second quarter of 2026, 3.1 per cent of jobs in Malta were vacant, a drop of 0.2 percentage points when compared to both the preceding quarter and to the second quarter of 2025 (Chart 5, Table 7). The job vacancy rate was highest within the construction sector (6.2 per cent) whilst the public administration, defence, education, human health and social work activities registered the lowest rate of job vacancies (1.2 per cent) (Table 7).
Small enterprises, with 1 to 49 employees, showed a higher job vacancy rate of 5.3 per cent, suggesting a greater demand for labour in this segment. Large enterprises, comprising 250 or more employees, exhibited a lower rate of job vacancies at 1.1 per cent (Table 8).
The private sector registered a job vacancy rate of 3.7 per cent in the second quarter of 2026 whereas 0.6 per cent of total jobs in the public sector were vacant during the same period (Table 9).
Note: The unemployment rate refers to the number of unemployed persons (15-74 years) as a percentage of the total labour force (15-74 years). Unemployment rates were obtained from the Labour Force Survey (LFS).
Tables
- xlsx Table 1. Number of job vacancies and occupied posts by economic activity of enterprise and period 34.38 KB
- xlsx Table 2. Number of job vacancies by size of enterprise and period 31.59 KB
- xlsx Table 3. Number of job vacancies by economic sector and period 31.04 KB
- xlsx Table 4. Number of occupied posts by economic activity of enterprise and period 34.22 KB
- xlsx Table 5. Number of occupied posts by size of enterprise and period 30.56 KB
- xlsx Table 6. Number of occupied posts by economic sector and period 31.08 KB
- xlsx Table 7. Job vacancy rate by economic activity of enterprise and period 33.24 KB
- xlsx Table 8. Job vacancy rate by size of enterprise and period 30.62 KB
- xlsx Table 9. Job vacancy rate by economic sector and period 29.14 KB
- xlsx All Tables 71.23 KB
Methodological Notes
1. The Job Vacancy Survey (JVS) is a quarterly enterprise survey carried out with over 3,200 entities employing one or more employees. Administrative sources are used to compile information relating to the public sector.
2. The objective of this survey, as laid down in the regulation (EC) No. 453/2008, is to provide information on the demand for labour at a reference date across units employing 1 or more employees and engaged in NACE sections B-T. The economic activity is classified according to NACE Rev. 2.1 (Nomenclature Statistique des Activités Économiques dans la Communauté Européenne).
3. Definitions:
● A job vacancy is defined as a paid post that is newly created, unoccupied, or about to become vacant, for which the employer is taking active steps and is prepared to take further steps to find a suitable candidate from outside the enterprise concerned, and which the employer intends to fill either immediately or within a specific period of time.
● Active steps to find a suitable candidate include:
notifying the job vacancy to the public employment services;
contacting a private employment agency;
advertising the vacancy in the media, for example, internet, newspapers and magazines;
advertising the vacancy on a public notice board;
approaching, interviewing or selecting possible candidates/potential recruits directly;
approaching employees and/or personal contacts;
using internships.
● The term ‘within a specific period of time‘ refers to the maximum time the vacancy is open and intended to be filled. When the period is unlimited, all vacancies for which active steps are ongoing after the reference date shall be reported.
● An occupied post means a paid post within the organisation to which an employee has been assigned. This value excludes all board members, self-employed owners, directors, partners and managers who are solely paid by way of profits, persons on unpaid leave, posts unoccupied due to long-term absences (e.g., parental leave or long-term sickness) together with employees of temporary employment agencies, outside contractors or consultants, and voluntary workers.
● The Job Vacancy Rate (JVR) is calculated using this formula:
● The Job Vacancy Survey takes a snapshot of the number of job vacancies and occupied posts on a specific day, known as the reference date. For 2017, the reference date was the 30th day of the end-of-quarter month (i.e., March, June, September, and December). As from 2018, the reference date was the 15th day of the end-of-quarter month (i.e., March, June, September, and December). Starting from the first quarter of 2024, the reference date has been changed to the 28th day of the middle quarter month (i.e., February, May, August, and November).
● The unemployment rate refers to the number of unemployed persons (15-74 years) as a percentage of the total labour force (15-74 years). Unemployment rates were obtained from the Labour Force Survey (LFS).
4. The NACE classification system, the Statistical Classification of Economic Activities in the European Community, has been updated to NACE Rev. 2.1. Further information on this reclassification is available through this link: NACE Rev 2.1.
This revision includes the reclassification of economic activities from NACE Rev 2 to NACE Rev 2.1, together with an update of the weights used to gross up the survey results based on the most recent target population estimates. Users are advised not to compare the figures presented in this release with those published in previous releases, as these methodological changes may affect comparability. The data presented in this release are subject to change.
Job vacancy statistics for Malta are also published by Eurostat in table jvs_q_r21 of its online database. At the time of publication, although this table is labelled according to NACE Rev. 2.1, it does not yet contain the fully revised series for Malta. Until Member States provide their revised time series, Eurostat have reclassified the data of each country using the figures they had been provided in NACE Rev 2. In view of this, users should exercise caution when using job vacancy statistics from this source, as the data may not fully reflect the new classification structure.
5. The data is classified by economic activity according to the NACE (Nomenclature Statistique des Activités Économiques dans la Communauté Européenne) classification of economic activities in the European Union. The data is presented in accordance with NACE Revision 2 Update 1 (NACE Rev. 2.1), reflecting the latest updates to the classification system.
The main changes in the classification at NACE section level introduced by NACE Rev. 2.1, compared with NACE Rev. 2, include:
a. Section J of NACE Rev. 2 has been split into two sections: Section J, ‘Publishing, broadcasting, and content production and distribution activities’ and Section K ‘Telecommunication, computer programming, consulting, computing infrastructure and other information service activities’. As a result, all the subsequent sections in NACE Rev. 2.1 shifted up one letter.
b. Group 41.1 ‘Development of building projects’ has been removed from section F. Its sole class, 41.10, has been reclassified under class 68.12 within section M (formerly section L).
c. Division 45 ‘Wholesale and retail trade and repair of motor vehicles and motorcycles’ has been discontinued from section G. The wholesale and retail activities of motor vehicles and motorcycles have been allocated to division 46 and 47 respectively, while the activities of maintenance and repair of motor vehicles and motorcycles were moved to section T (formerly section S).
d. The classification of real estate rental activities has been refined: rentals of own or leased real estate for periods of less than one year are now classified under Division 55 (Section I), whereas rentals for one year or longer remain under Division 68 (Section M – formerly section L).
More information on the reclassification can be found in the relevant Press Information Notice and in the News article by Eurostat.
6. Revisions have been carried out for the period 2017 to 2025 to improve the coherence of the Job Vacancy Survey (JVS) data with employment levels derived from the Business Register (BR). As part of this revision process, employment estimates were adjusted where necessary to better reflect the information available in the Business Register. In addtion, the data was re-classified in accordance with the updated NACE classification. This resulted in the reallocation of units were necessary and improved the consistency, comparability and accuracy of the statistics across the entire time series.
7. Figures that have a relative margin of error of 30 percent or more should be interpreted with caution. Such data may not be statistically representative due to the high potential for error.
8. Data in this news release is provisional and therefore subject to revisions. These revisions generally occur annually to align the estimates with the latest population figures. Additionally, quarterly revisions may be necessary to ensure the consistency of the data series. Also, totals may not add up due to rounding.
9. More information relating to this news release may be accessed at:
Sources and Methods
Statistical Concepts
Metadata
NACE Rev. 2.1 Classification
10. References to this news release are to be cited appropriately. For guidance on access and re-use of data please visit our dedicated webpage.
11. Further information on the regulation (EC) No. 453/2008 can be accessed here.
12. A detailed news release calendar is available online.
13. For further assistance send your request through our online request form.