

L-Indiċi tal-Prezzijiet bl-Imnut (RPI): Jannar 2026

It-tibdil fil-prezzijiet u l-effetti tiegħu fuq l-inflazzjoni
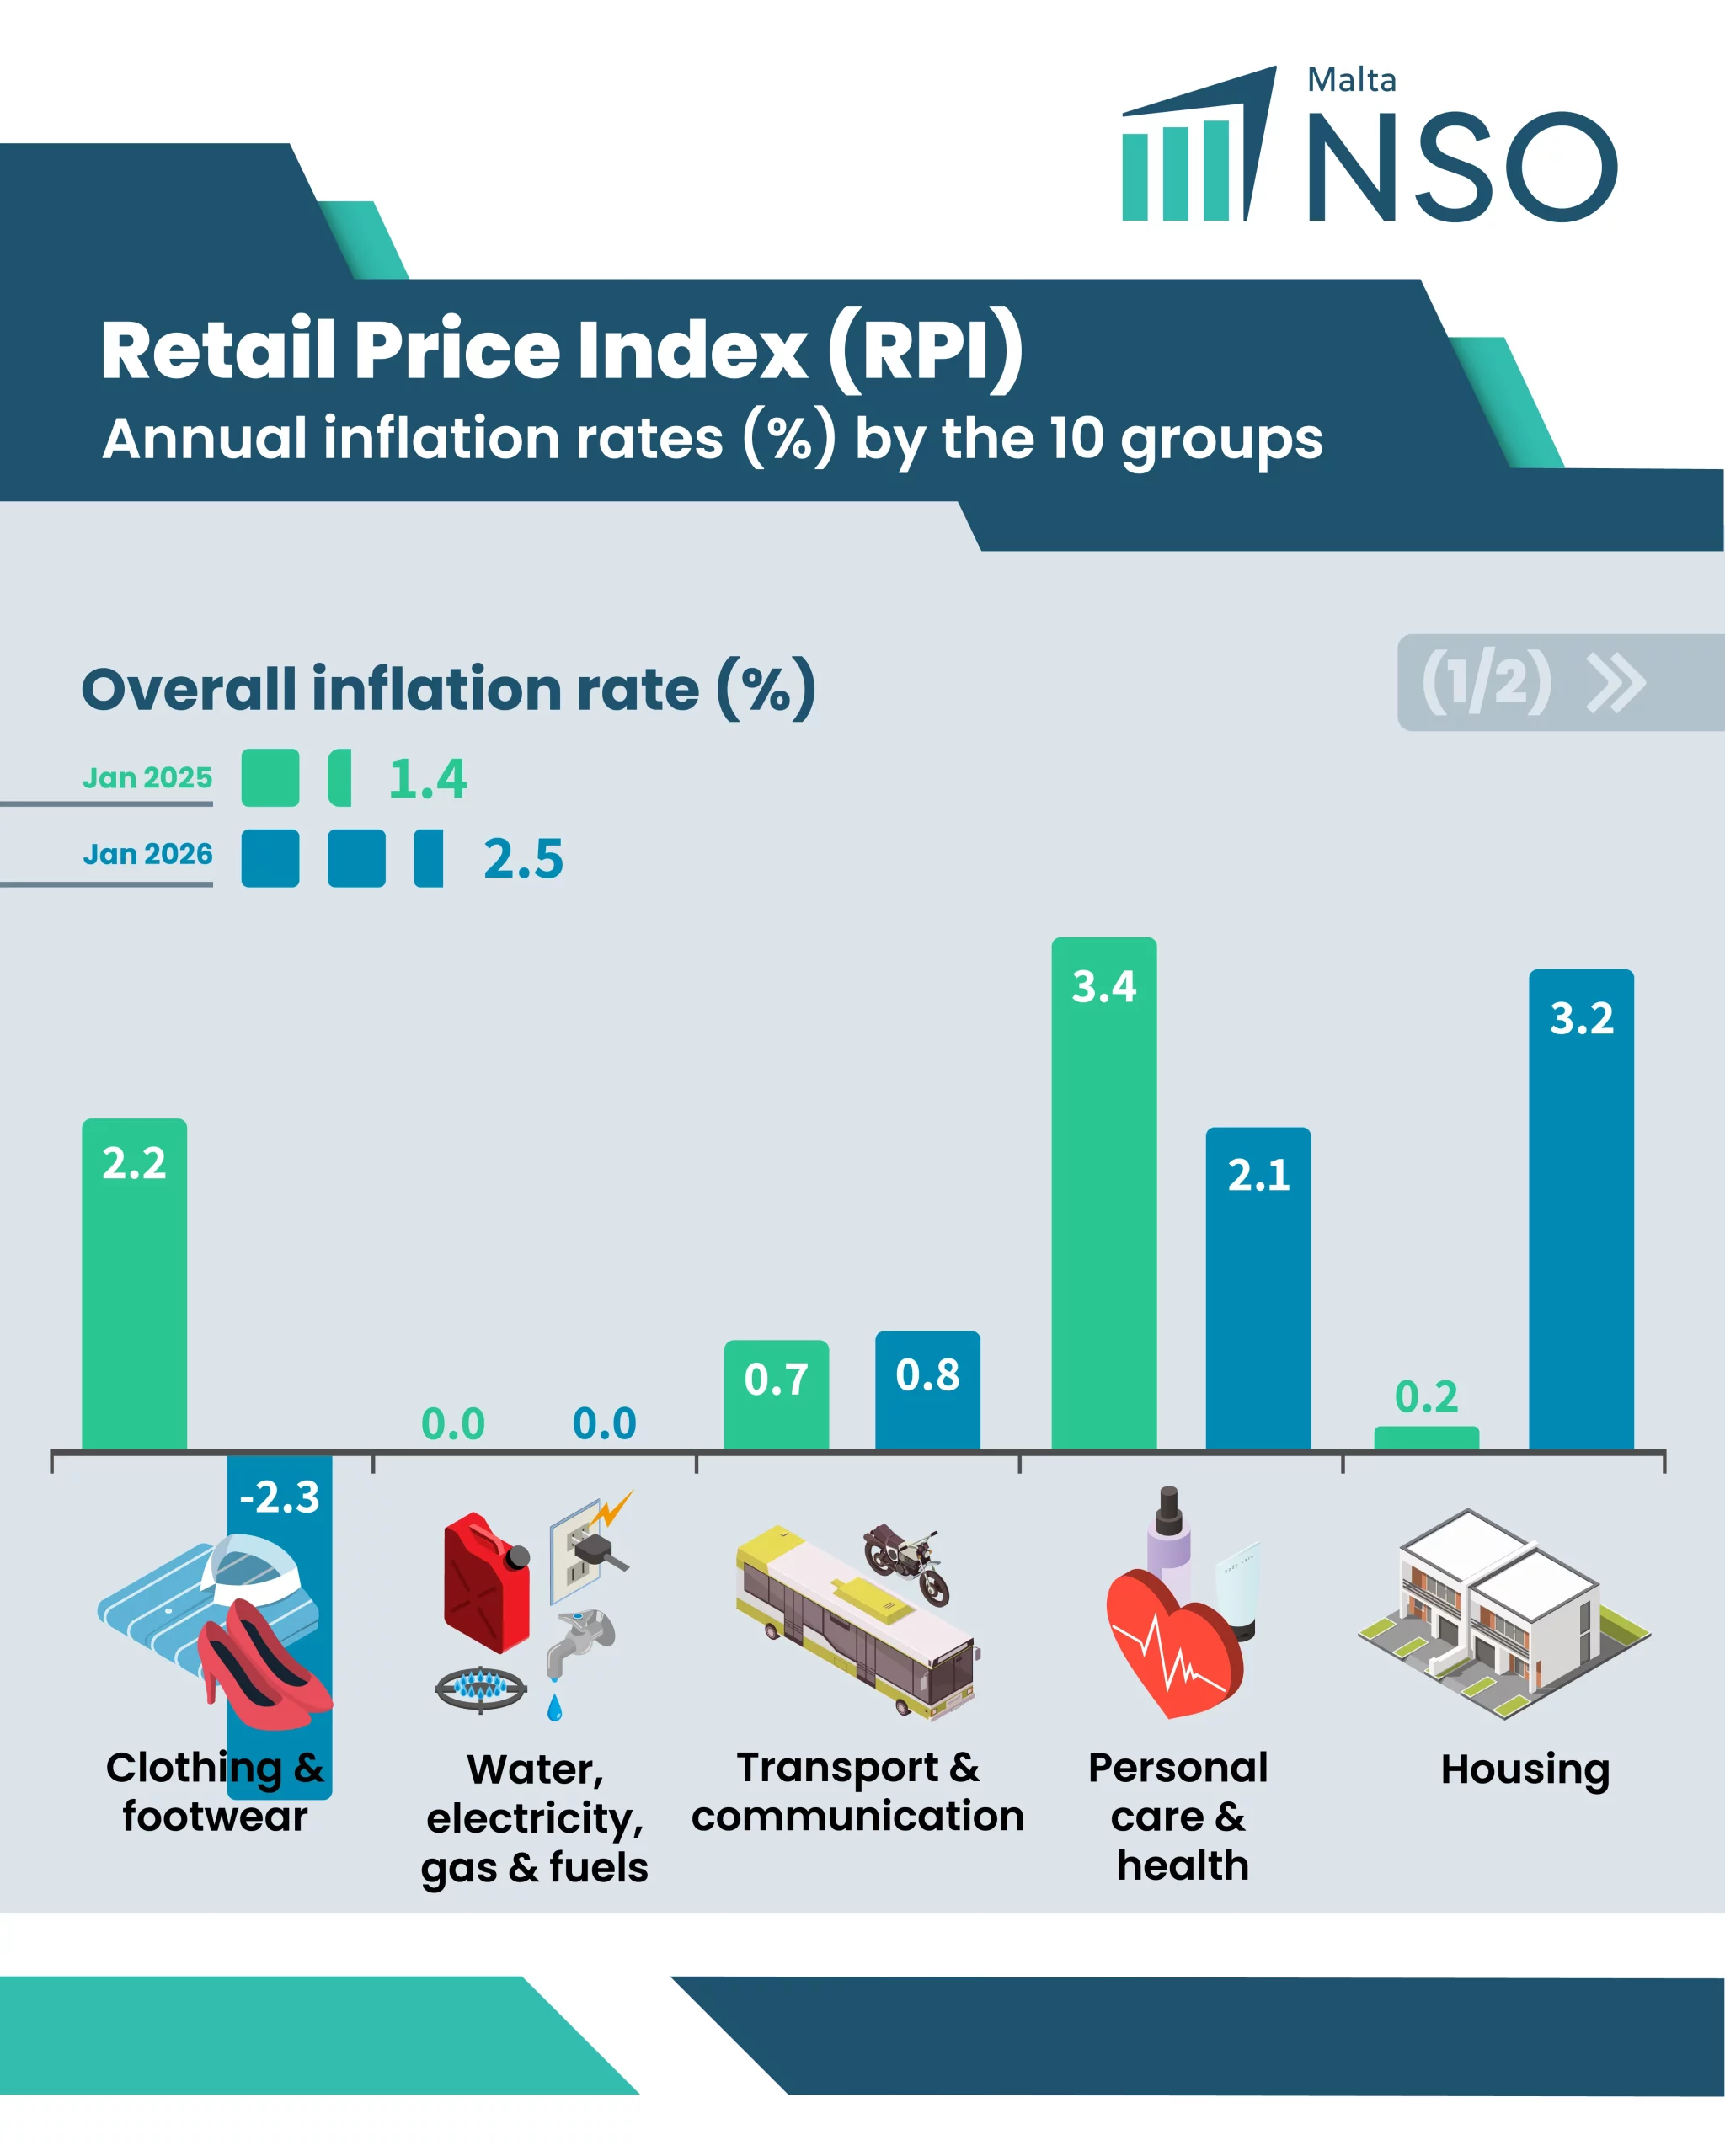
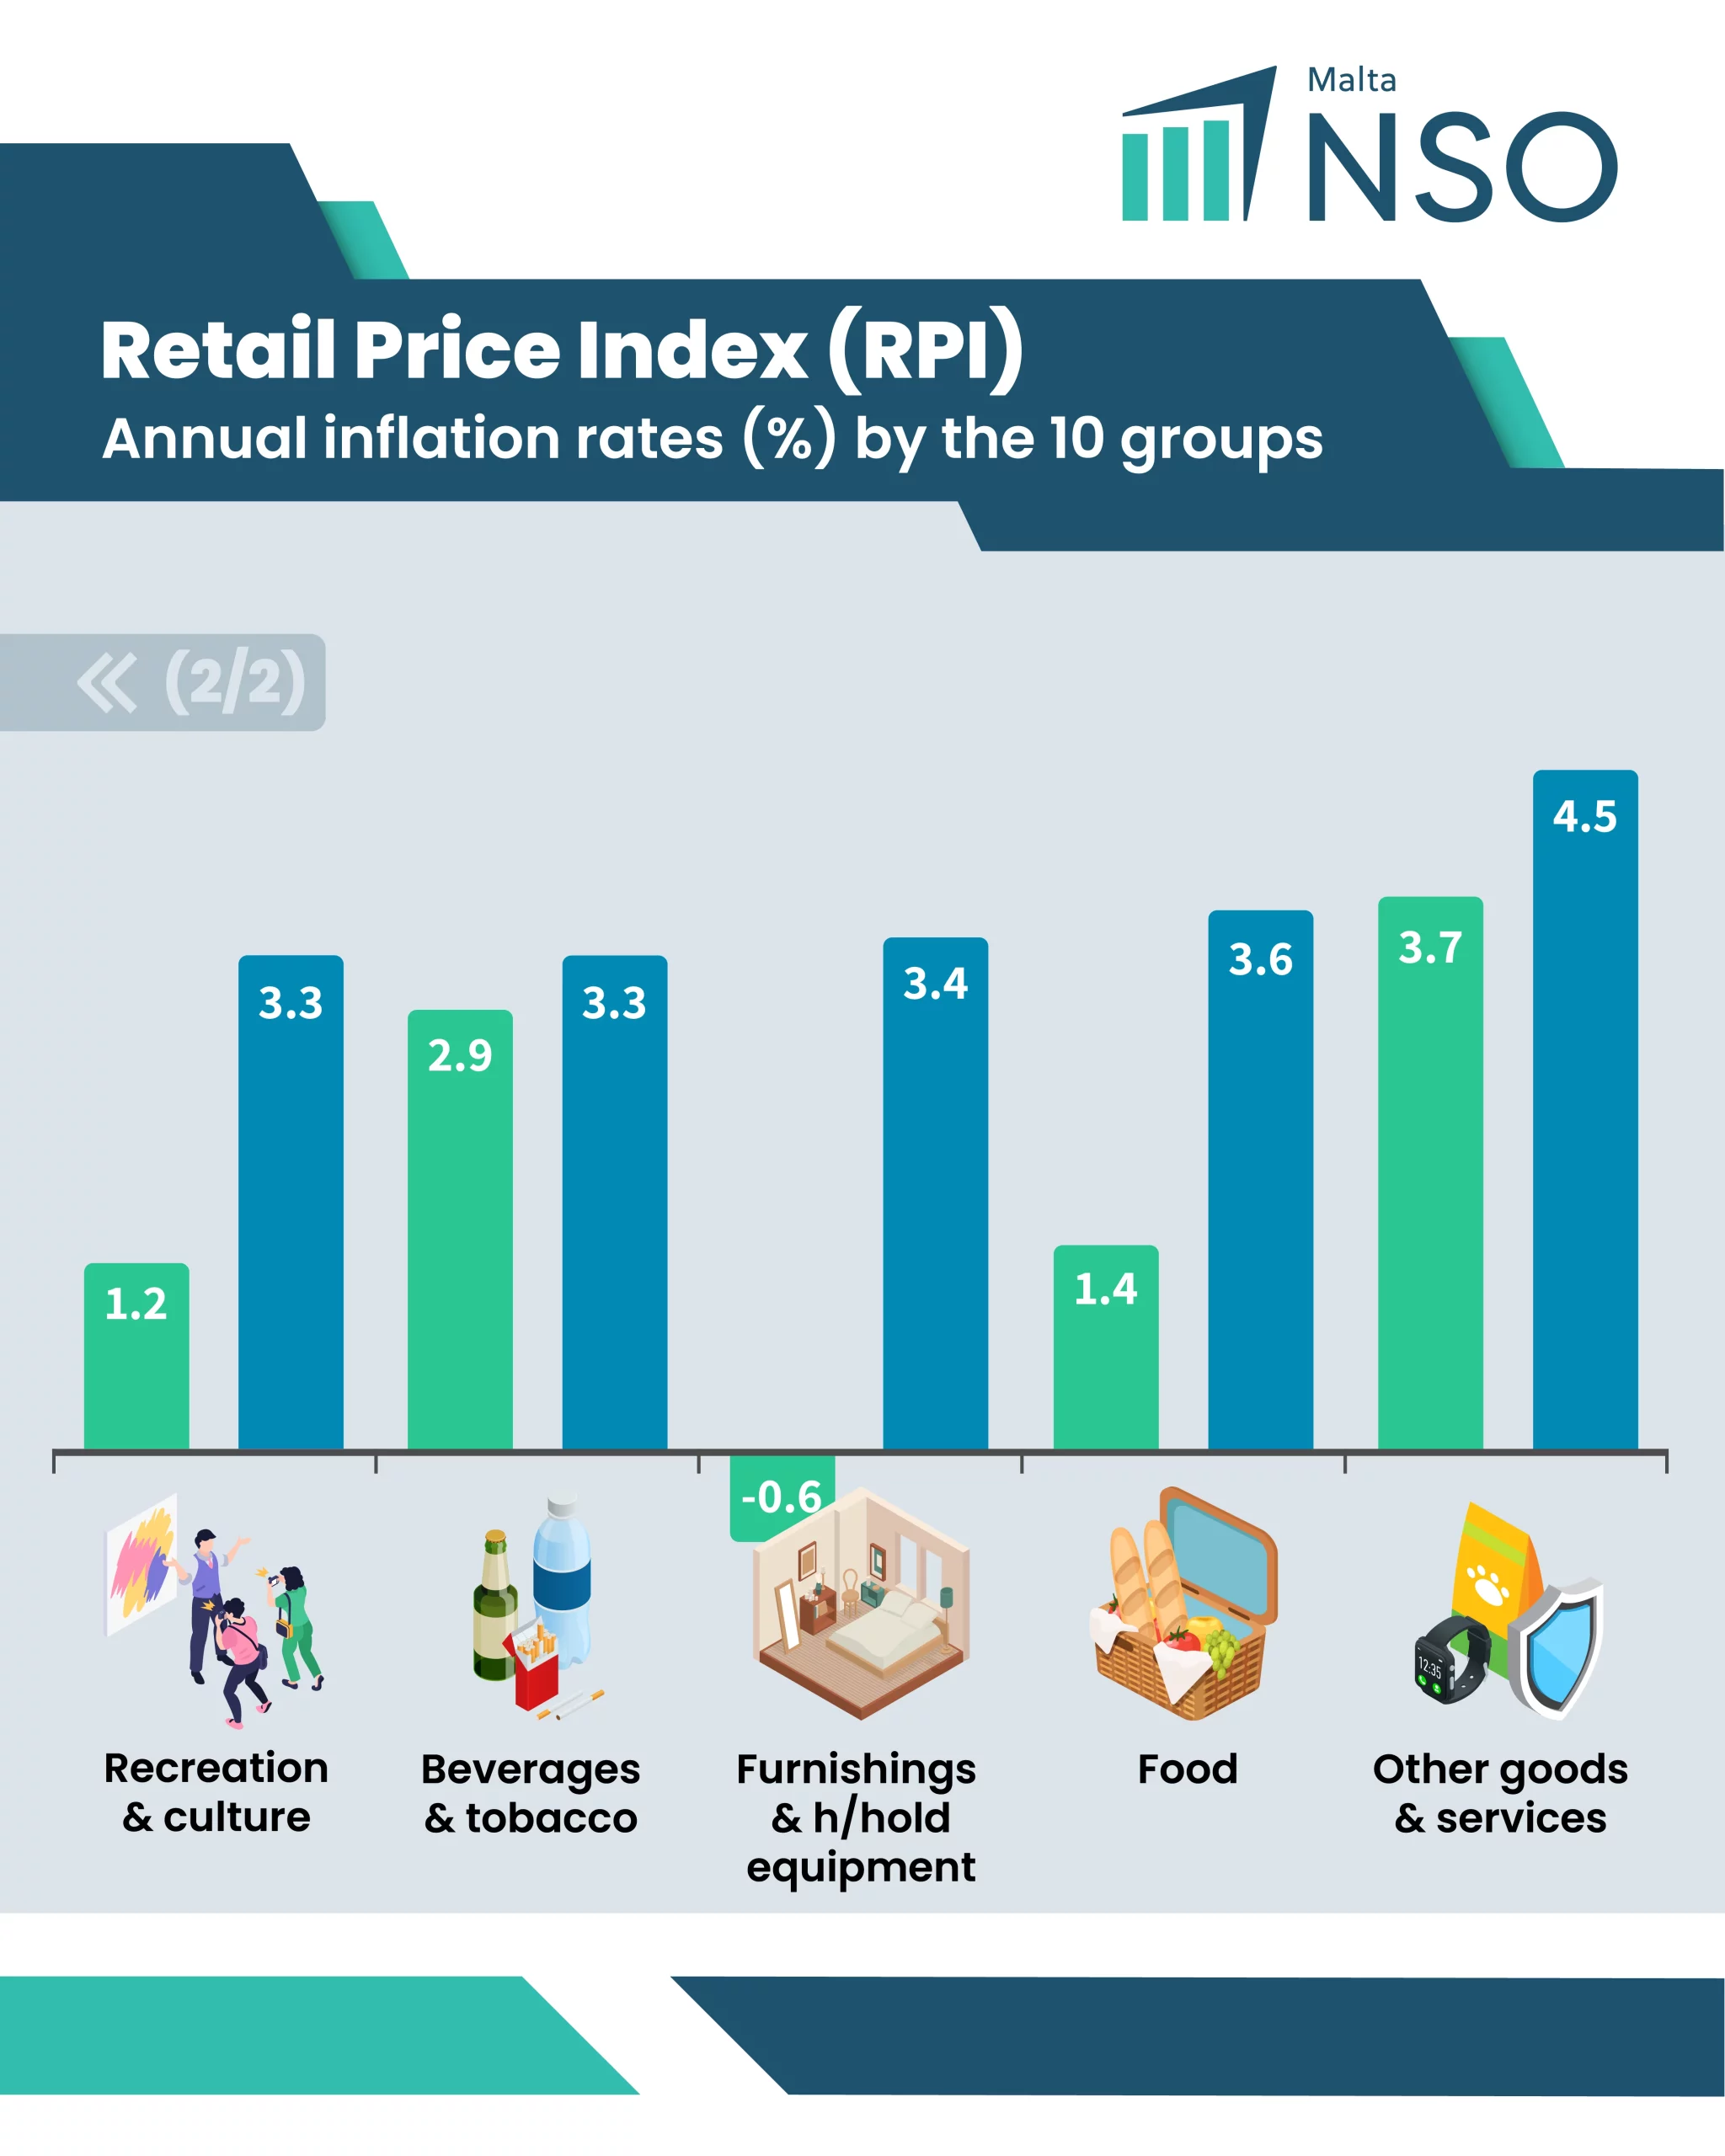
L-ogħla rati taʼ inflazzjoni fʼJannar 2026 kienu rreġistrati fi Prodotti u servizzi oħra (4.5 fil-mija) u fl-Ikel (3.6 fil-mija). Min-naħa l-oħra, l-aktar rati baxxi taʼ inflazzjoni annwali kienu rreġistrati fil-Ħwejjeġ u ż-żraben (-2.3 fil-mija) u fl-Ilma, l-elettriku, l-gass u l-fjuwils (0.0 fil-mija) (Tabelli nri 1 u 4).
Noti:
- L-Indiċi tal-Ikel jinkludi s-servizzi tar-ristoranti u t-take-aways.
- Serje kronoloġika fid-dettall taʼ dawn iċ-ċifri qiegħda fʼTabella nru 4.
FʼJannar 2026, l-akbar kontribuzzjoni pożittiva għall-inflazzjoni annwali ġiet mill-Indiċi tal-Ikel (+0.77 punti perċentwali), l-aktar minħabba prezzijiet ogħla tat-take-aways. It-tieni u t-tielet l-akbar kontribuzzjonijiet kienu nnotati fl-Indiċi taʼ Prodotti u servizzi oħra (+0.33 punti perċentwali) u fl-Indiċi tar-Rikreazzjoni u l-kultura (+0.33 punti perċentwali), l-aktar minħabba prezzijiet ogħla taʼ ġojjelli u għall-kiri taʼ avvenimenti taʼ rikreazzjoni u sport, rispettivament.
Kien hemm kontribuzzjoni negattiva għall-inflazzjoni annwali rreġistrata fl-Indiċi tal-Ħwejjeġ u ż-żraben (-0.15 punti perċentwali), l-aktar minħabba prezzijiet aktar baxxi tal-ħwejjeġ (Ċart nru 3, Tabella nru 5).
Noti:
- L-Indiċi tal-Ikel jinkludi s-servizzi tar-ristoranti u t-take-aways.
- Punt perċentwali huwa d-differenza aritmetika bejn żewġ persentaġġi.
- Serje kronoloġika fid-dettall taʼ dawn iċ-ċifri qiegħda fʼTabella nru 5.
L-aggregati
FʼJannar 2026, l-Indiċi taʼ Prodotti u servizzi oħra rreġistra l-ogħla rata annwali taʼ inflazzjoni bʼ4.5 fil-mija, li minnha l-Ġojjelli, arloġġi tal-idejn u oġġetti oħra rreġistraw rata annwali taʼ 22.8 fil-mija, il-Prodotti li jintużaw għall-ħasil u t-tisjir irreġistraw rata annwali taʼ 2.3 fil-mija, is-Servizzi veterinarji (inkluż ikel għall-annimali domestiċi) u servizzi domestiċi rreġistraw rata annwali taʼ 1.9 fil-mija, filwaqt li l-Assigurazzjonijiet, servizzi finanzjarji u servizzi oħra rreġistraw rata annwali taʼ 0.6 fil-mija.
L-Indiċi tal-Ħwejjeġ u ż-żraben irreġistra l-aktar rata baxxa taʼ inflazzjoni annwali bʼ-2.3 fil-mija, li minnha l-Ħwejjeġ irreġistraw rata annwali taʼ -2.1 fil-mija u ż-Żraben irreġistraw rata annwali taʼ -3.1 fil-mija (Tabelli nri 1 u 3).

Tables
Tables
Methodological Notes
1. Overview
The RPI measures monthly price changes in the cost of purchasing a representative basket of consumer goods and services. A closely related measure of price movements is the Harmonised Index of Consumer Prices (HICP). A description of differences between the HICP and the RPI can be found in methodological note 4 of this news release.
Each monthly RPI news release includes three different measures of inflation:
i. The annual inflation rate measures average price changes between the reference month and the same month of the previous year. Although responsive to recent changes in price levels, this measure can be influenced by one-off effects in either month.
ii. The monthly inflation rate compares price changes between the reference month and the previous month. This measure can be highly influenced by seasonal effects.
iii. The 12-month moving average rate overcomes the volatility of the above two rates by comparing the average of the latest 12 indices to the average of the previous 12 indices. This measure is less sensitive to temporary changes in prices.
2. Terminology
i. There are ten main groups in the RPI covering consumption. These are described below in methodological note 4 (iii).
ii. ‘Contribution’ in the context of the RPI means the impact on the annual inflation rate made by each group making up the Index.
iii. ‘Weights’ are estimates of the share of importance held by particular groups of products and services in the overall consumption.
3. Accessing data
NSO news releases and further information on HICP and RPI may be accessed from here.
Eurostat news releases on HICP may be accessed from Eurostat’s website.
4. Differences between RPI and HICP
Both indices are compiled using a large and representative selection of around 550 different goods and services, for which price movements are regularly monitored. Around 50,000 separate price quotations are used each month to compile the index.
The methodology underlying RPI and HICP is similar, yet they differ by the following:
i. The RPI captures private households only, whereas the HICP covers private households, institutional households (such as retirement homes) and foreign visitors to Malta.
ii. The two indices have different base years. The RPI is a fixed-base index, whose weights are updated periodically using relevant sources. Being a fixed-based index, its weights are reviewed every time the base year is changed.
The HICP is a chain-linked index, a statistical technique for linking two indices by relating the values of one index to the value of the other index in the previous period. This makes possible the introduction of newly significant goods and services into the HICP on an annual basis.
iii. The coverage of the HICP is based on ECOICOP ver. 2 (European Classification of Individual Consumption by Purpose, version 2), whereas the RPI has a different set of codes for each group of items, as listed in the table below.
| ECOICOP ver. 2 division | Weight (out of 1000) |
RPI group | Weight (out of 100) |
||
|---|---|---|---|---|---|
| 1 | Food and non-alcoholic beverages | 181.89 | 1 | Food (including restaurant services and take-aways) | 21.49 |
| 2 | Alcoholic beverages and tobacco | 34.39 | 2 | Beverages and tobacco | 5.56 |
| 3 | Clothing and footwear | 41.53 | 3 | Clothing and footwear | 6.62 |
| 4 | Housing, water, electricity, gas and other fuels | 97.42 | 4 | Housing | 7.90 |
| 5 | Furniture, household equipment and routine household maintenance | 81.38 | 5 | Water, electricity, gas and fuels | 3.31 |
| 6 | Health | 47.42 | 6 | Furnishings and household equipment | 6.97 |
| 7 | Transport | 124.83 | 7 | Transport and communication | 22.10 |
| 8 | Communication | 49.77 | 8 | Personal care and health | 8.81 |
| 9 | Recreation and culture | 81.56 | 9 | Recreation and culture (including education) | 9.90 |
| 10 | Education | 27.70 | 10 | Other goods and services | 7.34 |
| 11 | Restaurants and hotels | 154.27 | |||
| 12 | Insurance and financial services | 16.45 | |||
| 13 | Personal care, social protection and miscellaneous goods and services | 61.41 | |||
| Total | 1000.00 | Total | 100.00 |
Note: Figures in this table may not add up due to rounding.
Apart from the disparities identified above, both the RPI and the HICP:
i. have the same geographic coverage, implying that both indices refer to the whole country;
ii. utilise the same price collection methodologies; and,
iii. utilise the same outlet sample (with some exceptions).
5. Explaining divergences between RPI and HICP inflation
The HICP and RPI price indices bear several similarities and often produce similar inflation estimates. However, in some cases, inherent methodological differences between the two indices, particularly differences in the consumption basket and in the weights given to these products, cause the inflation rates reported by these two measures to diverge.
6. Further information
Price quotations for the new items introduced in the latest RPI index series started being collected in December 2016.
From January 2017, the RPI started being published with December 2016 as its base. All RPI indices pertaining to the years prior to 2017 were re-based to December 2016=100. This latest index series may be linked to the previous one by using a linking coefficient of 1.1199.
The basket of consumption items considered for the RPI is reviewed periodically, in line with the Household Budget Survey (HBS), during which, information about household consumption is collected over a 12-month period, in order to obtain an estimate of the average household expenditure. New products are included in the basket of items when achieving a sales volume of over one part per thousand of total consumer expenditure covered by the RPI. The information collected through the HBS exercise is then further supplemented by additional data sources to obtain the final RPI weights.
The HICP is published with 2025 as its base year. The previous series with reference 2015=100 has been discontinued. Commission Regulation (EU) No 2025/1182 provides the legal basis for updating the HICP reference year from 2015=100 to 2025=100. There might be slight differences when comparing the series with past data due to rounding.
The HICP largely follows National Accounts (NA) concepts of what constitutes household consumption in determining the index scope, and mainly uses NA data to weight the items in the basket.
The HICP weighting scheme and the treatment of seasonal items are both in accordance with the Commission Regulation (EU) No 2020/1148.
Users are advised to consult the NSO before comparing the results of the RPI and the HICP.
More information on the metadata behind HICP and RPI news releases may be accessed from:
Sources and methods
Statistical concepts
Metadata (RPI)
ECOICOP ver. 2 structure
RPI and HICP manual
NSO statistical database
ECB digital publication on inflation
7. Reassessments / revisions
Note that the RPI series is published with reference base December 2016, whereas the HICP series is published with base year 2025, in line with Eurostat base year revisions.
8. Time series
Data from 1946 onwards is accessible through the following link in the selected indicators section (Index of Inflation).
9. A detailed news release calendar is available online.
10. References to this news release are to be cited appropriately. For guidance on access and re-use of data please visit our dedicated webpage.
11. For further assistance send your request through our online request form.
L-Indiċi tal-Prezzijiet bl-Imnut (RPI): Jannar 2026

- FʼJannar 2026, ir-rata annwali tal-inflazzjoni kif imkejla mill-RPI kienet taʼ 2.5 fil-mija, tnaqqis mit-2.7 fil-mija tax-xahar taʼ qabel.
- Ir-rata medja ta’ tnax-il xahar għal Jannar 2026 kienet taʼ 2.5 fil-mija.
- L-akbar kontribuzzjoni pożittiva għall-inflazzjoni annwali kienet irreġistrata mill-Indiċi tal-Ikel (+0.77 punti perċentwali), filwaqt li l-kontribuzzjoni negattiva waħdanija għall-inflazzjoni annwali ġiet mill-Indiċi tal-Ħwejjeġ u ż-żraben (-0.15 punti perċentwali).