

Il-Punti ewlenin
- Fl-2025, it-turiżmu annwali żied mal-50,767 persuna mal-popolazzjoni residenti ta’ Malta ta’ nofs is-sena, biex b’hekk il-popolazzjoni effettiva laħqet is-632,011.
- Minħabba l-istaġjonalità tat-turiżmu, il-popolazzjoni effettiva laħqet l-ogħla punt tagħha f’Awwissu b’671,576 u l-aktar punt baxx tagħha f’Diċembru b’594,428.
- Fl-2025, l-intensità tat-turiżmu telgħet għal 8.7 mit-8.2 tas-sena ta’ qabel, li fissret aktar turisti għal kull 100 resident fil-gżejjer.
- Matul Awwissu, San Ġiljan kellu l-ogħla popolazzjoni turistika, li wasslet għal intensità turistika ta’ 143.0 – jiġifieri kien hemm 143 turist għal kull 100 resident.
Il-Kummentarju
L-intensità tat-turiżmu
Fl-2025, il-popolazzjoni tar-residenti taʼ nofs is-sena kienet stmata li laħqet il-581,244. Meta mbagħad tingħadd ukoll il-preżenza tat-turisti, bħala medja matul is-sena kollha, dan l-għadd jiżdied bʼ50,767, u tintlaħaq popolazzjoni effettiva taʼ 632,011 (Tabella nru 1). Minħabba l-istaġjonalità tat-turiżmu, il-popolazzjoni effettiva tinbidel minn xahar għall-ieħor. Meta l-popolazzjoni residenti nżammet kostanti għall-valur tal-istima taʼ nofs is-sena, fl-aktar xahar baxx tat-turiżmu (Diċembru) il-popolazzjoni effettiva kienet ta’ 594,428 (13,184 turist).
Matul l-eqqel xahar tat-turiżmu (Awwissu), il-popolazzjoni effettiva żdiedet bʼ90,332 turist biex bʼhekk laħqet is-671,576. Din hija differenza ta’ 77,148 persuna (13.0 fil-mija) fil-popolazzjoni effettiva bejn l-ogħla u l-inqas xhur tat-turiżmu fl-2025 (Tabella nru 1, Ċart nru 1).
L-impatt tal-popolazzjoni turistika fuq il-popolazzjoni residenti jista’ jkun mifhum f’termini ta’ intensità turistika. Hawnhekk, l-intensità tat-turiżmu hija mifhuma bħala l-proporzjon ta’ ljieli mqattgħin f’kull għamla ta’ akkomodazzjoni turistika għal kull 100 resident kuljum. Fl-2025, l-intensità tat-turiżmu kienet ta’ 8.7, jiġifieri kien hawn bejn wieħed u ieħor disa’ turisti għal kull 100 resident. Din hija żieda ta’ turist wieħed għal kull 100 resident meta mqabbel mas-sena ta’ qabel. L-istaġjonalità għandha impatt għoli fuq l-intensità tat-turiżmu. Fl-2025, l-intensità tat-turiżmu laħqet il-15.5 f’Awwissu, filwaqt li f’Diċembru kienet ta’ 2.3. Dan ifisser li fl-eqqel xahar tat-turiżmu kien hemm 13-il turist aktar għal kull 100 resident meta mqabbel max-xahar bl-aktar turiżmu baxx (Diċembru) (Tabella nru 1).
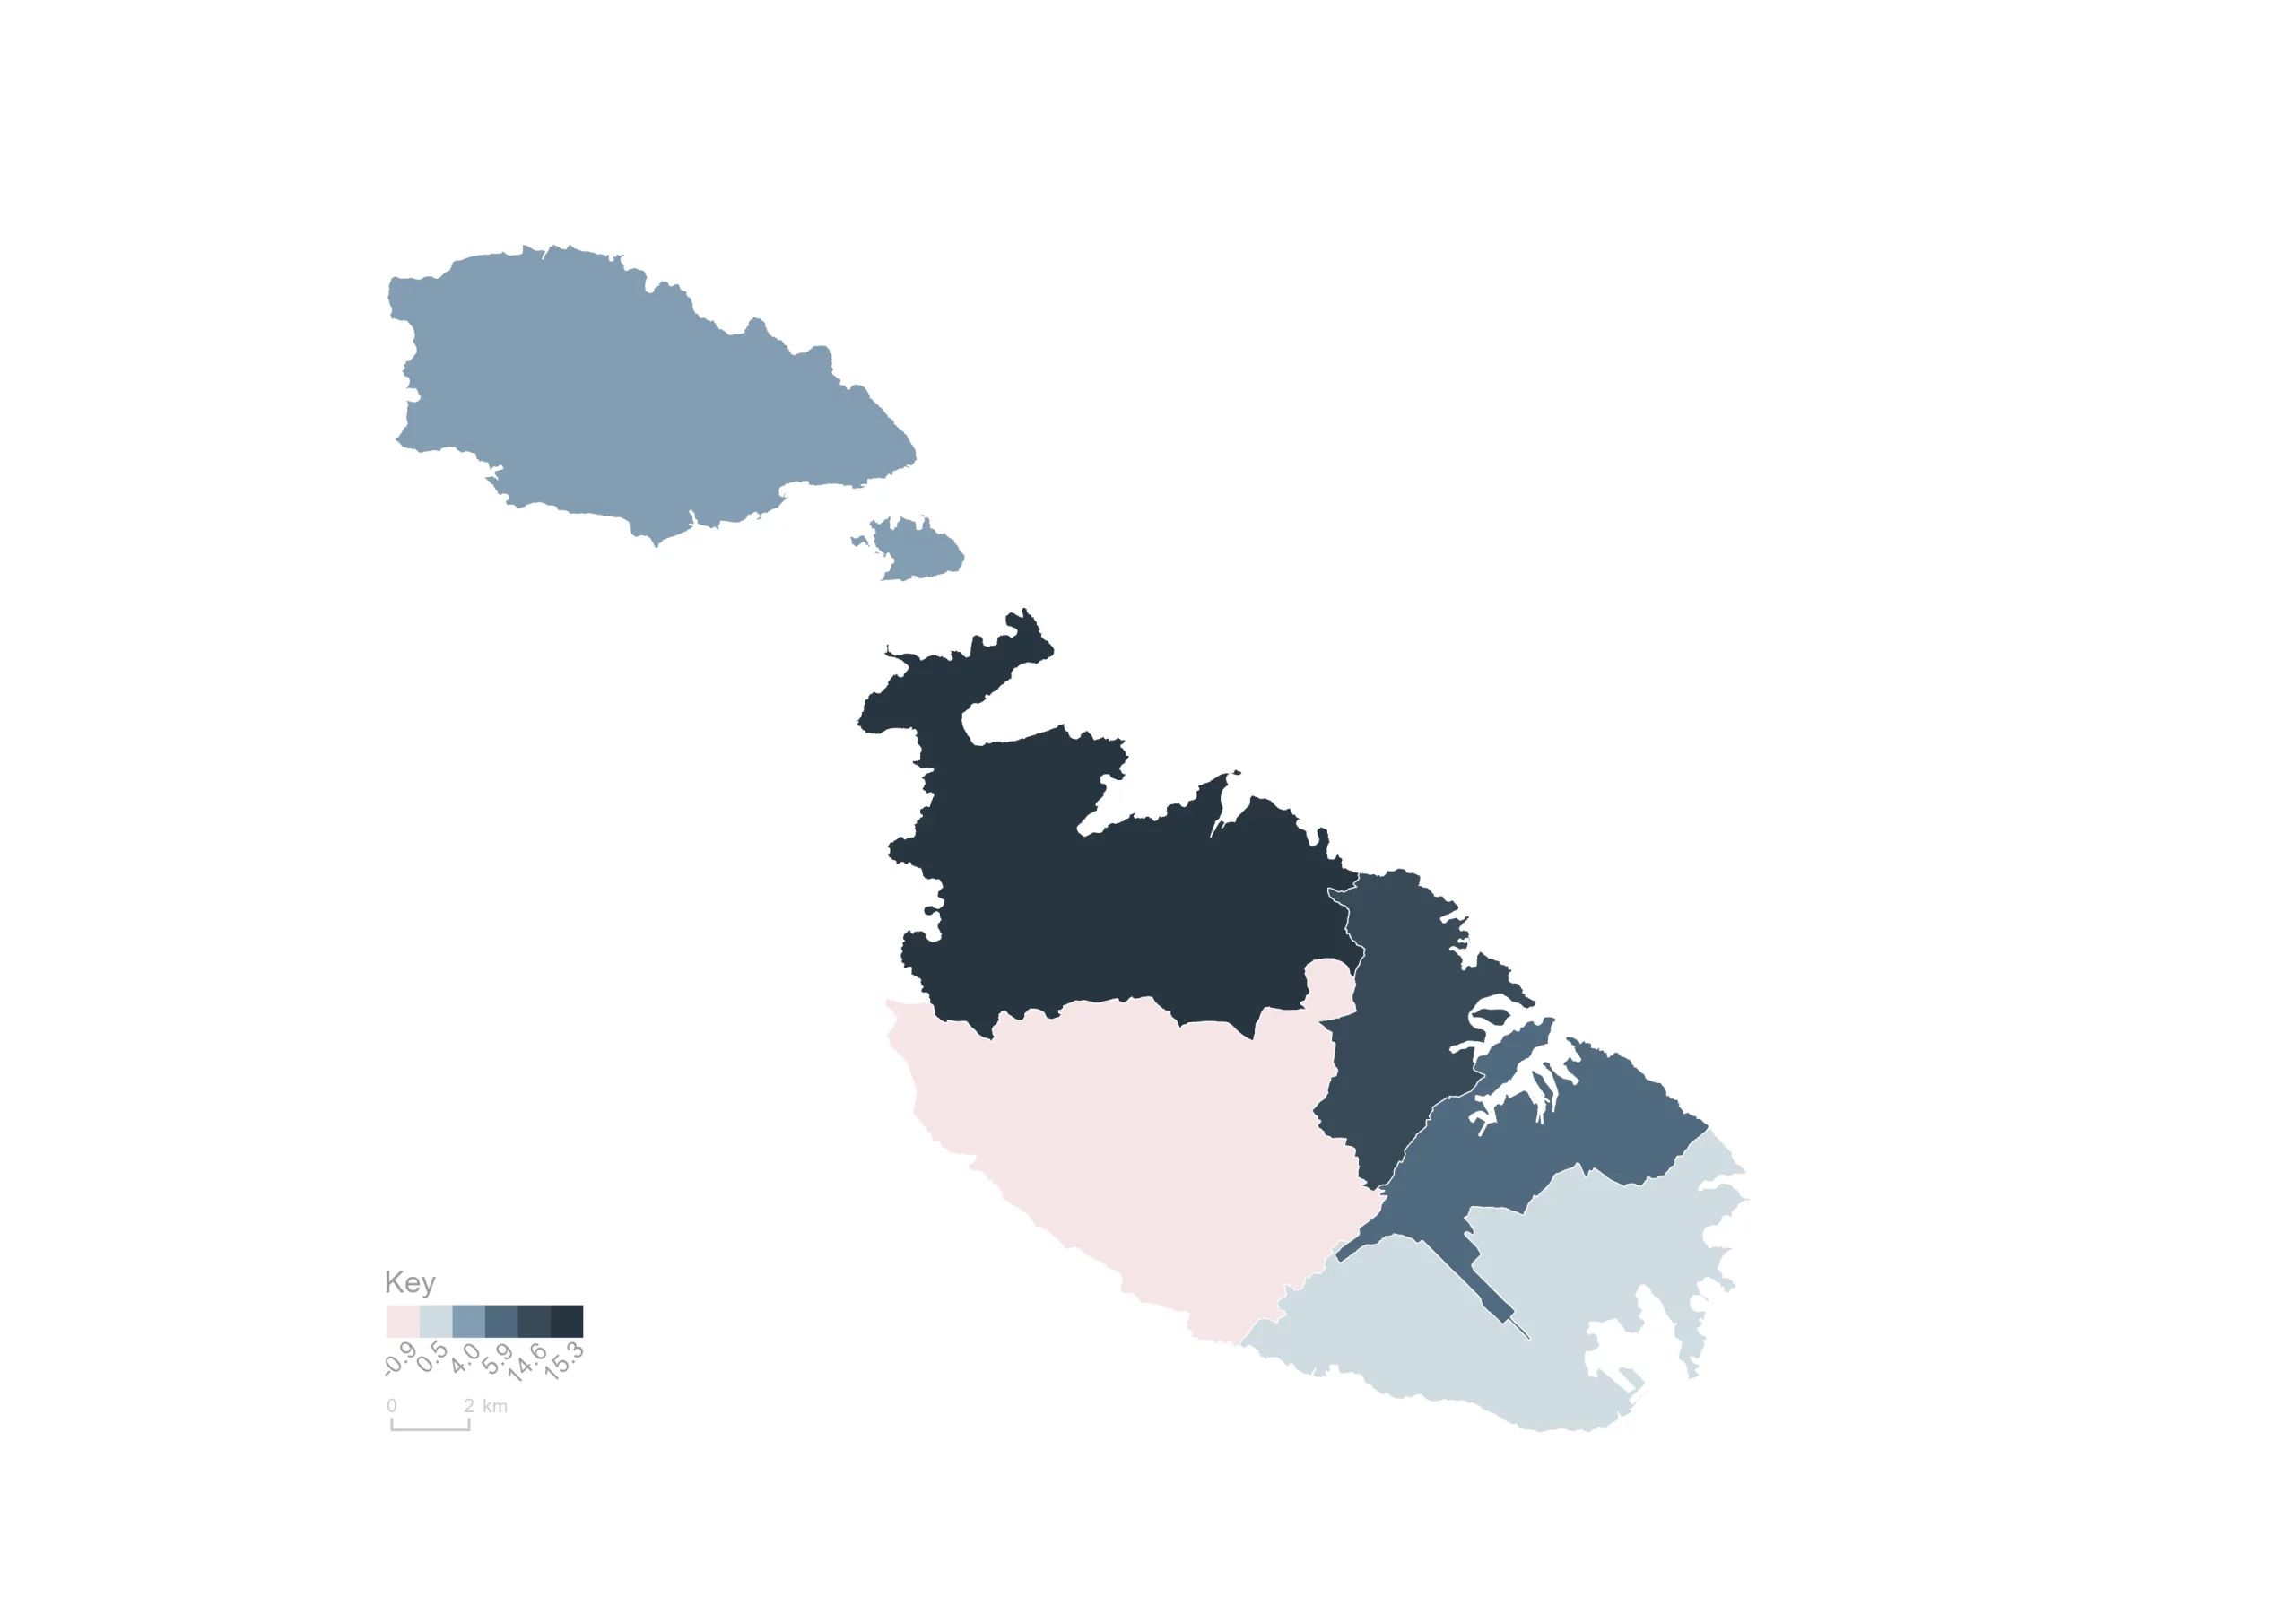
Minbarra li tinbidel bl-istaġun, l-intensità tat-turiżmu tinbidel bil-ġeografija wkoll. Id-distrett tat-Tramuntana tal-Port huwa l-akbar distrett f’termini tal-popolazzjoni residenti u għandu l-akbar popolazzjoni turistika medja fis-sena. Għaldaqstant, id-distrett tat-Tramuntana tal-Port kellu l-akbar popolazzjoni effettiva fl-2025. Madankollu, meta titqies l-intensità tat-turiżmu, id-distrett tat-Tramuntana jaqbeż id-distrett tat-Tramuntana tal-Port b’valur ta’ 15.3 meta mqabbel ma’ 14.6, li jfisser li hemm madwar turist wieħed aktar għal kull 100 resident fid-distrett tat-Tramuntana meta mqabbel mad-distrett tat-Tramuntana tal-Port (Tabella nru 2, Mappa nru 1).
Mappa nru 1. L-intensità tat-turiżmu, bid-distrett
Sena taʼ riferenza: 2025
Id-differenzi ġeografiċi nħassew aktar meta kienet mistħarrġa l-intensità tat-turiżmu fil-livell tal-lokalità. Hekk, San Ġiljan kellu l-ogħla intensità tat-turiżmu bi 83 turist għal kull 100 resident (82.9) fl-2025. Warajh, kien hemm il-Belt Valletta (80.5). Tqabbila mas-sena ta’ qabel, turi li l-Belt Valletta kellha l-akbar żieda f’dik li hija intensità turistika, meta minn 69.9 telgħet għal 80.5. Dan ifisser li kien hemm 11-il turist aktar għal kull 100 resident fil-Belt Valletta fl-2025 meta mqabbel mal-2024 (Tabella nru 4).
L-impatt tal-popolazzjoni tat-turiżmu jistaʼ jitkejjel ukoll fʼtermini tad-daqs taż-żona ġeografika. Id-densità tal-popolazzjoni tkejjel l-għadd ta’ persuni għal kull kilometru kwadru u l-impatt tat-turiżmu fuq id-densità tal-popolazzjoni jista’ jkun magħdud billi tkun ikkalkulata d-densità bl-użu tal-popolazzjoni effettiva. Fl-2025, id-densità tal-popolazzjoni residenti taʼ nofs is-sena kienet ta’ 1,845 resident għal kull kilometru kwadru. Meta ngħaddet ukoll il-popolazzjoni turistika medja tas-sena, din żdiedet għal 2,006 persuni kull kilometru kwadru. Fid-distretti, l-akbar daqqa nħasset fid-distrett tat-Tramuntana tal-Port. Fl-2025, id-densità tal-popolazzjoni residenti ta’ nofs is-sena kienet ta’ 7,718-il resident għal kull kilometru kwadru, filwaqt li meta ngħadd ukoll l-għadd medju ta’ turisti f’dan id-distrett, din żdiedet b’1,127 persuna għal kull kilometru kwadru, u laħqet it-8,845 (Tabella nru 3).
Fost il-lokalitajiet bl-ogħla volumi taʼ turiżmu, id-densità tal-popolazzjoni żdiedet bil-kbir meta ngħaddet il-popolazzjoni turistika. Fl-2025, id-densità tal-popolazzjoni residenti ta’ nofs is-sena fʼTas-Sliema kienet ta’ 17,703 residenti għal kull kilometru kwadru. Din żdiedet għal 25,268 persuna kull kilometru kwadru meta ngħaddet il-popolazzjoni medja annwali tat-turiżmu fil-lokal. Filwaqt li l-Gżira kellha valur taʼ densità tal-popolazzjoni effettiva aktar baxx meta mqabbel maʼ Tas-Sliema fl-2025 (16,425), hija kellha l-akbar żieda fʼtermini assoluti meta jingħaddu n-numru ta’ turisti għal kull kilometru kwadru – 3,809 persuni (Tabella nru 5).
Differenzi tal-istaġun fl-ogħla lokalitajiet tat-turiżmu
FʼAwwissu, l-eqqel xahar tat-turiżmu, San Ġiljan kellu l-ogħla intensità tat-turiżmu, bʼ143.0 turist għal kull 100 resident, żieda ta’ 16.5 meta mqabbel mas-sena ta’ qabel. Il-Belt Valletta segwiet bʼintensità turistika ta’ 98.5, żieda taʼ 16.4 fuq is-sena ta’ qabel (Tabella nru 6, Mappa nru 2).
Mappa nru 2. L-intensità tat-turiżmu fis-sitt lokalitajiet ewlenin tat-turiżmu fʼAwwissu 2025
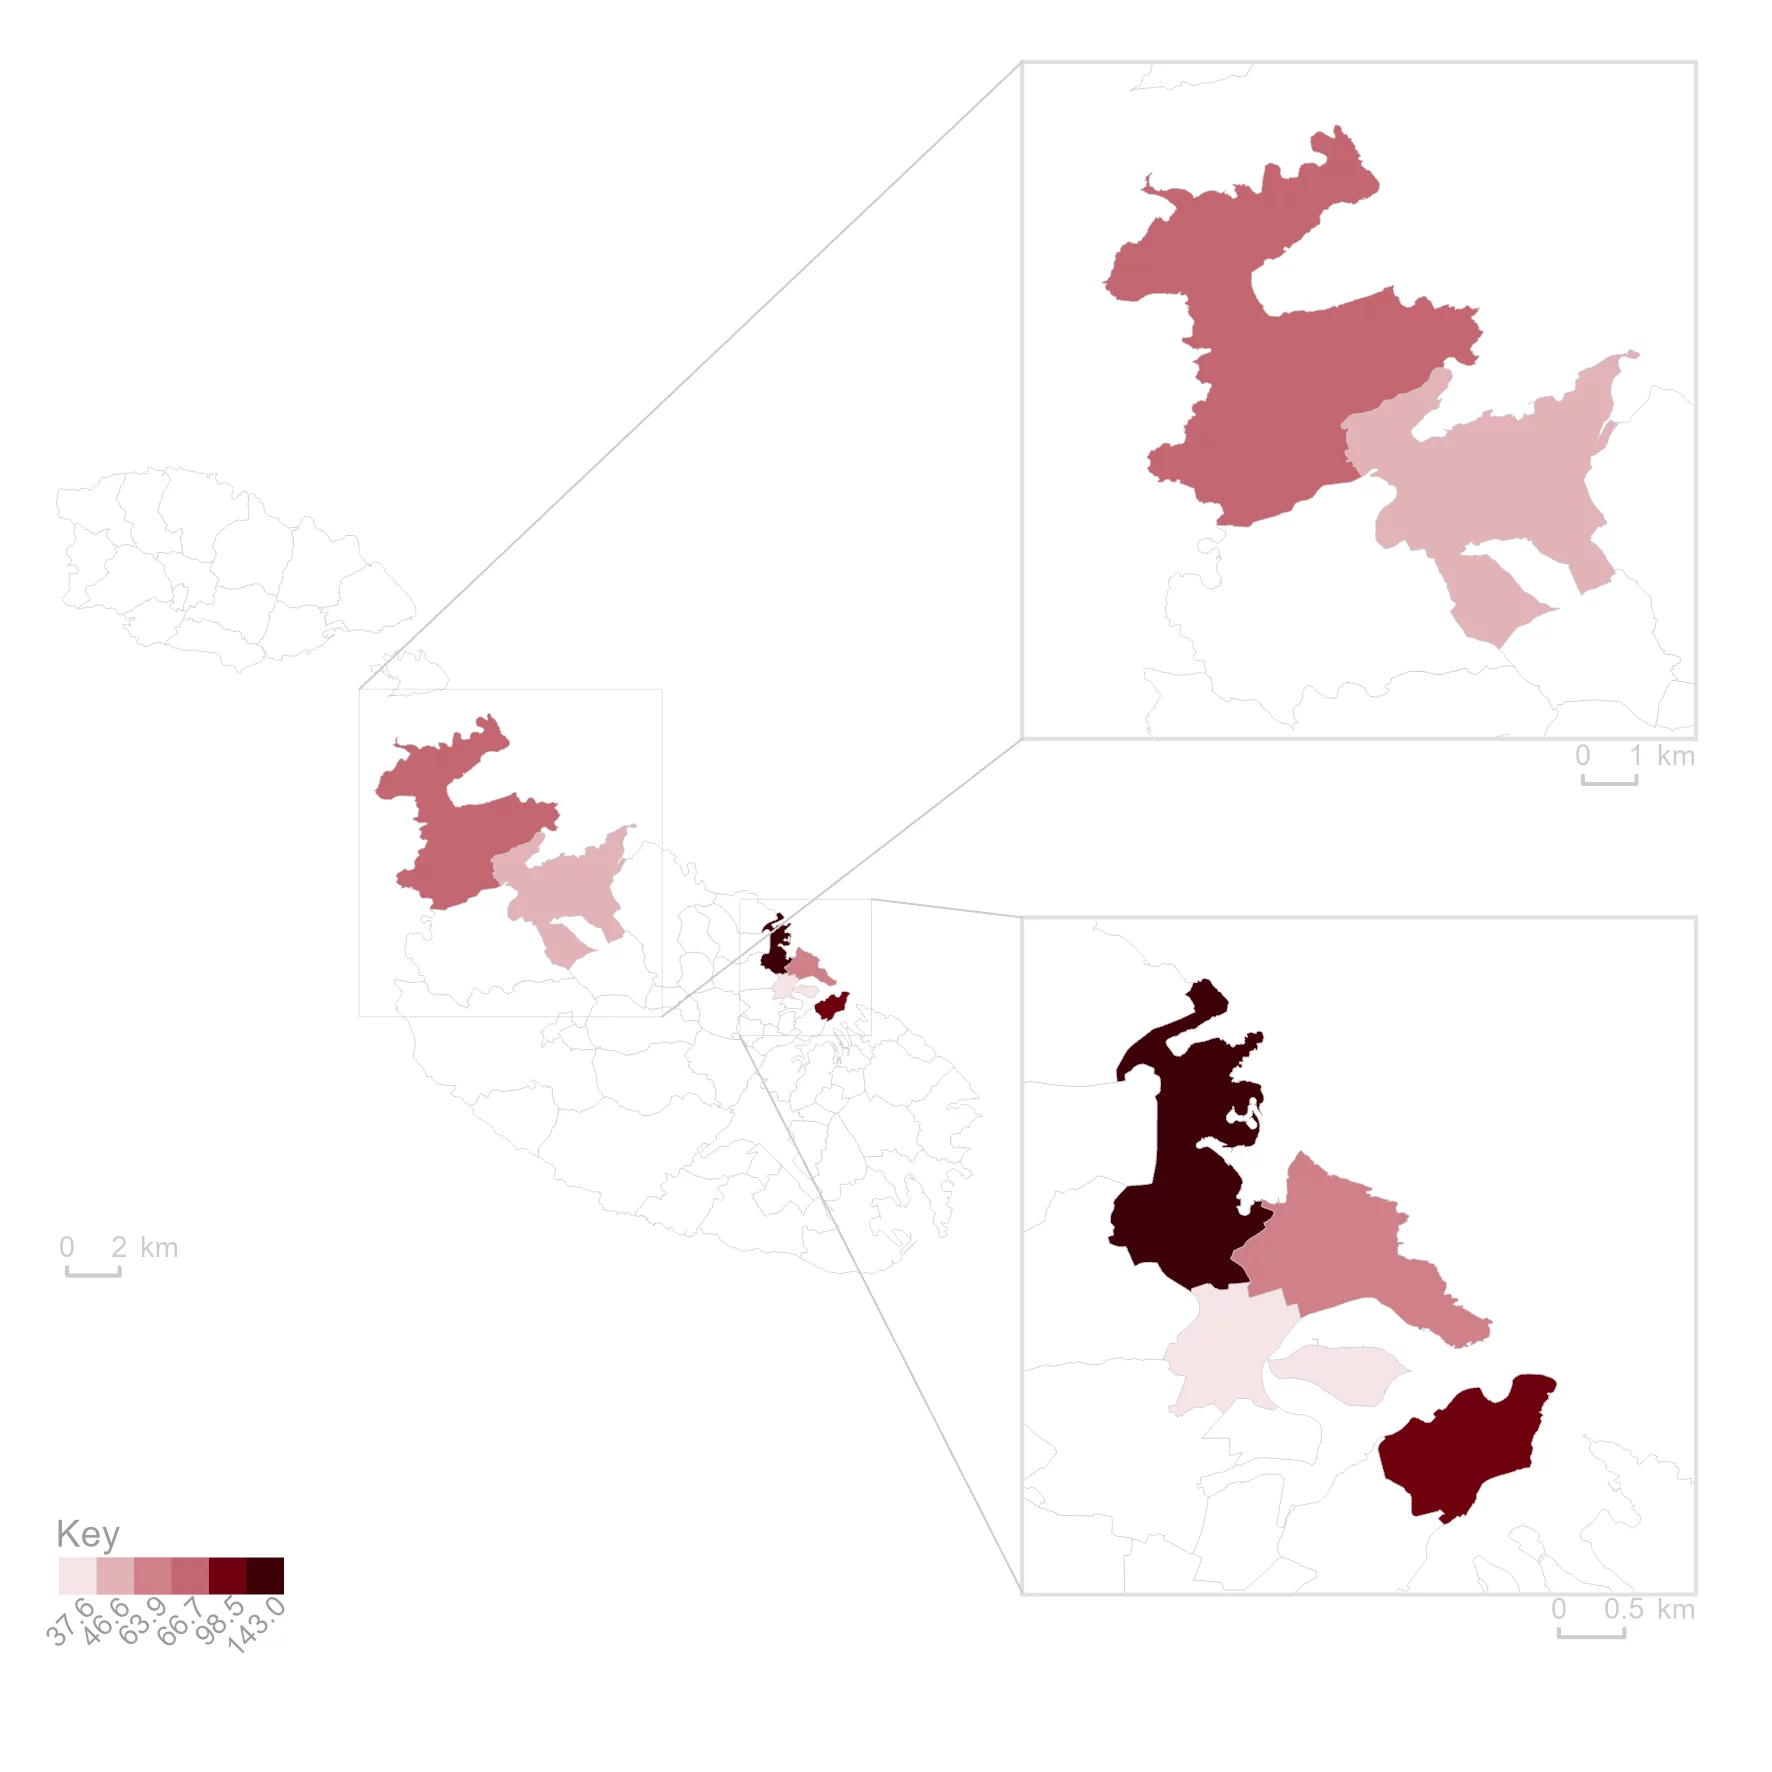
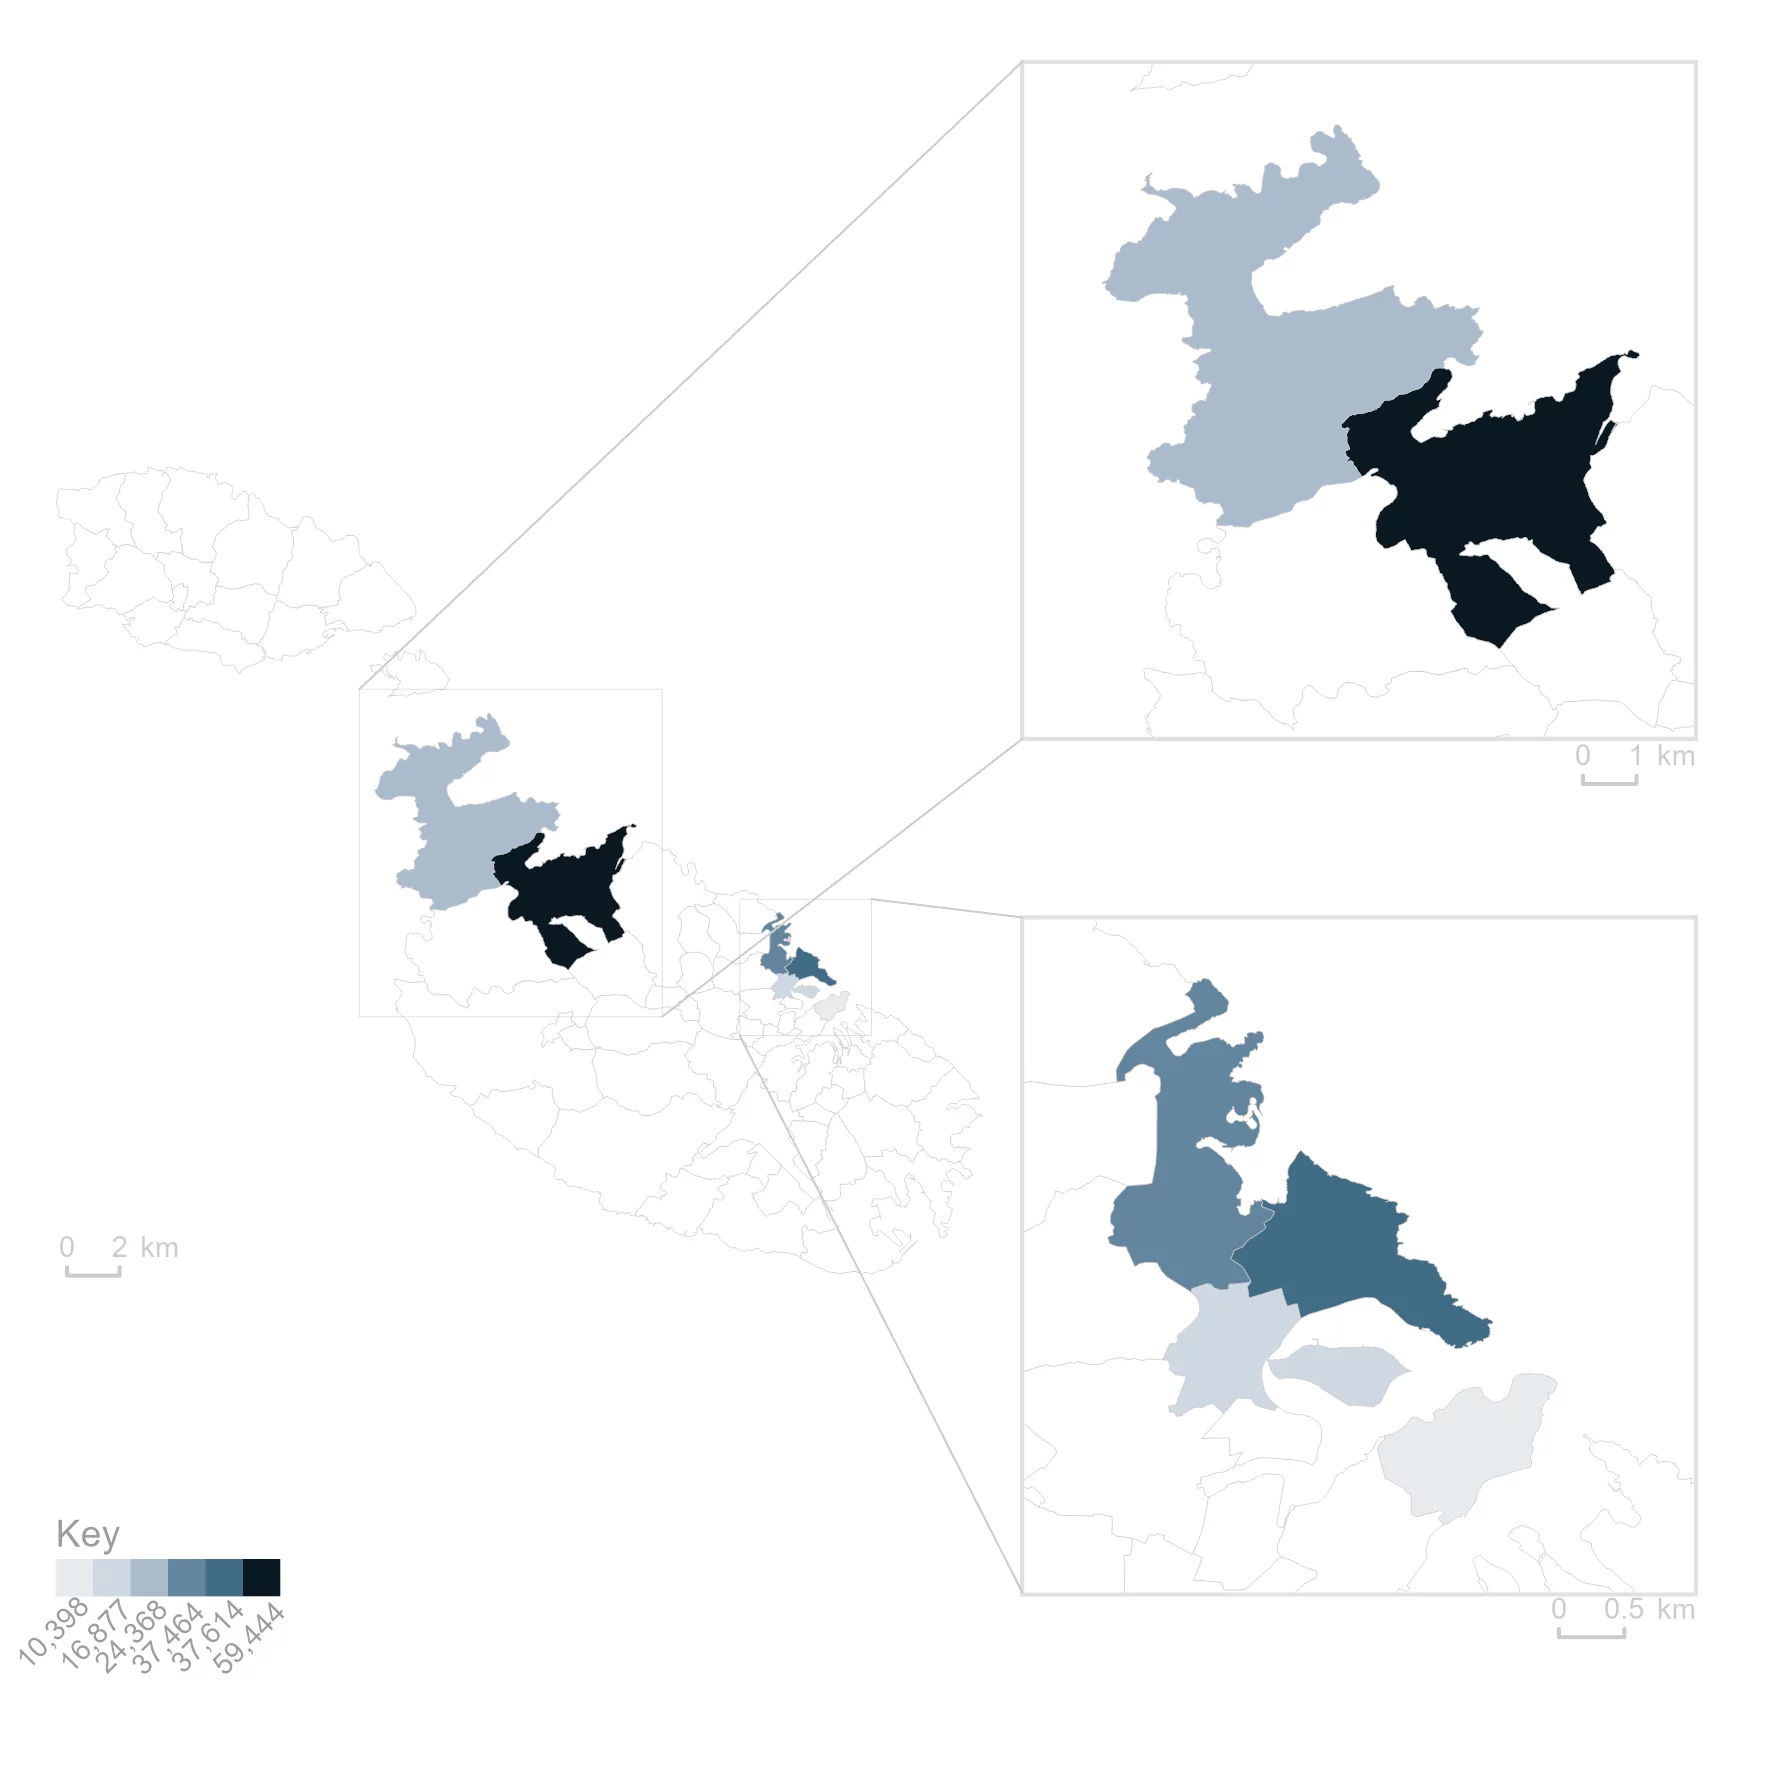
F’termini ta’ popolazzjoni effettiva, l-istima ta’ San Pawl Il-Baħar kienet ta’ 59,444 fl-eqqel xahar tat-turiżmu. Wara, kien hemm Tas-Sliema b’37,614. Dawn huma żidiet ta’ 1.6 fil-mija u 7.7 fil-mija fuq is-sena ta’ qabel (Tabella nru 6, Mappa nru 3, Ċart nru 2).
F’Diċembru, xahar baxx għat-turiżmu, l-intensità tat-turiżmu kienet l-ogħla fil-Belt Valletta (55.9), għalkemm f’valur li kien ħafna inqas minn dak li deher f’Awwissu (98.5) (Tabella nru 8, Ċart nru 3).
Mappa nru 3. Il-popolazzjoni effettiva fis-sitt lokalitajiet ewlenin tat-turiżmu fʼAwwissu 2025
Fl-eqqel xahar tat-turiżmu, Awwissu, id-densità tal-popolazzjoni tiżdied bil-kbir fil-lokalitajiet li għandhom volumi għoljin ta’ turiżmu. Fl-2025, Tas-Sliema kellha l-ogħla densità tal-popolazzjoni meta ngħaddu flimkien il-popolazzjoni residenti u l-għadd tat-turisti, li kienu jġibu d-29,023 persuna għal kull kilometru kwadru. Din hija żieda ta’ 11,320 persuna għal kull kilometru kwadru fuq il-popolazzjoni residenti. F’Awwissu, id-densità tal-popolazzjoni effettiva f’San Ġiljan kienet inqas minn dik f’Tas-Sliema, imma ż-żieda fid-densità kienet akbar, bi 13,702 persuni addizzjonali għal kull kilometru kwadru. Fl-aktar xahar baxx tat-turiżmu, Diċembru, Tas-Sliema baqgħet bl-ogħla densità tal-popolazzjoni għalkemm din iż-żieda fid-densità tal-popolazzjoni kienet bejn wieħed u ieħor darbtejn inqas minn dik ta’ Awwissu meta jingħaddu t-turisti (Tabella nru 8, Ċart nru 4).
Tables
- xlsx Table 1. Country-level tourism intensity by period 17.84 KB
- xlsx Table 2. District-level tourism intensity - Annual 13.98 KB
- xlsx Table 3. District-level resident, tourist and effective population density - Annual 13.40 KB
- xlsx Table 4. Locality-level tourism intensity for the top 6 tourism localities - Annual 13.79 KB
- xlsx Table 5. Locality-level resident, tourist and effective population density for the top 6 tourism localities - Annual 13.60 KB
- xlsx Table 6. Tourism intensity for the top 6 tourism localities - August 13.33 KB
- xlsx Table 7. Locality-level resident, tourist and effective population density for the top 6 tourism localities - August 13.37 KB
- xlsx Table 8. Tourism intensity in the top 6 tourist localities for the high (August) and low (December) tourism months 13.83 KB
- xlsx All Tables 50.98 KB
Methodological Notes
- Conceptual definitions:
● Tourist population: The number of tourists per day in a given time period (month, quarter or year) and geographical area, after accounting for outbound tourists. Refer to conceptual definition outbound tourist correction for further details. Totals of the tourist population may not match exactly across different time periods because the figures are estimated as an average per day within each specific period. Therefore, summing the averages from smaller periods—such as quarters—to get a yearly total will not equal the estimate calculated over the entire year. Totals also may not tally across geographical area breakdowns – refer to note locality of longest stay for more details.
● Outbound tourist correction: Since Maltese residents travel abroad at the same time as inbound tourists arrive, the tourism figures are adjusted to reflect this. Outbound tourist nights data for the applicable time period (month, quarter, or year) are extracted from TOURSTAT. This data is then distributed by locality using the harmonized distribution of outbound tourists by locality and district from the National Tourism Survey (NTS). An estimate of the net tourists nights was then calculated by subtracting the outbound tourist nights from the inbound estimates. Note that since the NTS only covers the population aged 15 and over, a small discrepancy may exist in the corrected figures.
● Locality of longest stay:
a. The locality of longest stay, as collected by the TOURSTAT survey, is being used as the reference locality.
b. The locality of longest stay is the locality in which the tourists have spent most of their nights while in MALTA. If a tourist stays in multiple localities during their stay, all nights are assigned to the locality where they spent most of their nights.
E.g. An inbound tourist spends a total of 10 nights in MALTA: 8 in San Ġiljan, and 2 in Valletta. The locality of longest stay is San Ġiljan, and all 10 nights are attributed to this locality.
c. In some cases, no primary locality is specified, such as when a person stays in a different location each night. When compiling estimates at lower geographical breakdowns, such as locality, these cases are excluded. However, for country-level data, all inbound tourist nights are included. As a result, totals for estimates broken down by geographic areas may not match the country-level totals presented across different tables.
● Geographical information
a. The 68 localities are grouped into 6 districts (local administrative units) – Southern Harbour, Northern Harbour, South Eastern, Western, Northern and Gozo and Comino. More details on how the localities are grouped can be found from the Districts (Local Administrative Unit).
b. The areas, in km2, used for the calculation of all population density estimates are as tabulated below:
| Malta |
|---|
| 315.0 |
| Southern Harbour | Northern Harbour | South Eastern | Western | Northern | Gozo & Comino |
|---|---|---|---|---|---|
| 26.2 | 24.0 | 50.1 | 72.4 | 73.6 | 68.7 |
| San Ġiljan | San Pawl il-Baħar | Tas-Sliema | Il-Mellieħa | Il-Gżira | Valletta |
|---|---|---|---|---|---|
| 1.6 | 14.5 | 1.3 | 22.6 | 1.0 | 0.8 |
● Usually resident population: Refers to all persons who have their usual residence in a Member State at the reference time.
● Usual residence: Refers to the place where a person normally spends the daily period of rest, regardless of temporary absences for purposes of recreation, holidays, visits to friends and relatives, business, medical treatment or religious pilgrimage. Usual residents of a specific geographical area are:
i. Those who have lived in their place of usual residence for a continuous period of at least 12 months before the reference time; or
ii. Those who arrived in their place of usual residence during the 12 months before the reference time with the intention of staying there for at least one year.
● Mid-year population: Calculated by averaging start-of-the-year and end-year usual resident population estimates. The estimate would be the average population as at the end of June.
2. Variable Definitions:
● Time period (t): Number of days in the given time period under consideration. E.g. If the month August is being analysed, t = 31.
● Area (A): The area in the locality/district/region under review.
● Mid-year population (P mid): The average of the beginning and end-year estimation of the number of residents in the locality/district/region under review.
● Tourist nights (tourn): Number of tourist nights in a given time period (t) and in the locality/district/region under review.
● Tourist nights per day (tournpd): The effective number of tourists per day over a given time period (t) and in the locality/district/region under review. This figure takes into account outbound tourism. This figure is also referred to as the tourist population.
● Tourism intensity (Ti): The number of tourist nights in all forms of accommodation (rented and non-rented) per 100 residents per day, in a given time period (t) and in the locality/district/region under review. The superscript ‘inbound’ and ‘outbound’ distinguishes between the two tourism populations.
● Tourism density (Td): The number of tourist nights in all forms of accommodation (rented and non-rented) per day per km2, in a given time period (t) and in the locality/district/region under review.
● Effective population (Peff): The mid-year population plus the tourist nights per day in a given time period (t) and in the locality/district/region under review.
3. Equations:
4. Data Sources:
| Component | NSO Data Source | Metadata |
|---|---|---|
| Inbound and Outbound tourist nights data by date of departure. | TOURSTAT Survey - Living Conditions and Tourism Unit | https://nso.gov.mt/themes_sources___met/tourstat-survey/ |
| Outbound tourist locality of residence information by month of departure. | National Tourism Survey - Living Conditions and Tourism Unit | https://nso.gov.mt/themes_sources___met/national-tourism-survey/ |
| Mid-year population estimates | Population and Migration Unit | https://nso.gov.mt/metadata-reports/#demography |
5. The locality of residence for outbound tourists is obtained from the National Tourism Survey (see methodological note 1: outbound tourist correction). However, the survey’s reference period is the quarter of arrival, whereas for consistency with TOURSTAT data (which provides tourist nights), the quarter of departure is required. Consequently, data from more recent rounds of the National Tourism Survey may include tourists who departed in previous quarters of 2024 and were not captured in the data used at the time of analysis. Estimates produced by geographical breakdown for 2024 were therefore revised to adjust for the locality distribution available in the most recent data from the National Tourism Survey.
2024 figures have been revised when compared to those figures published in the Tourism Intensity: 2024 News Release.
Additionally, due to an update in the weighting methodology used in the National Tourism Survey, estimates for 2023 and 2024 have been revised and supersede previously published figures, and further details can be found in the respective news release which can be accessed here.
6. A detailed news release calendar is available online.
7. References to this news release are to be cited appropriately. For guidance on access and re-use of data please visit our dedicated webpage.
8. For further assistance send your request through our online request form.
